Aleut vs Canadian Vision Disability
COMPARE
Aleut
Canadian
Vision Disability
Vision Disability Comparison
Aleuts
Canadians
2.6%
VISION DISABILITY
0.0/ 100
METRIC RATING
304th/ 347
METRIC RANK
2.2%
VISION DISABILITY
25.8/ 100
METRIC RATING
191st/ 347
METRIC RANK
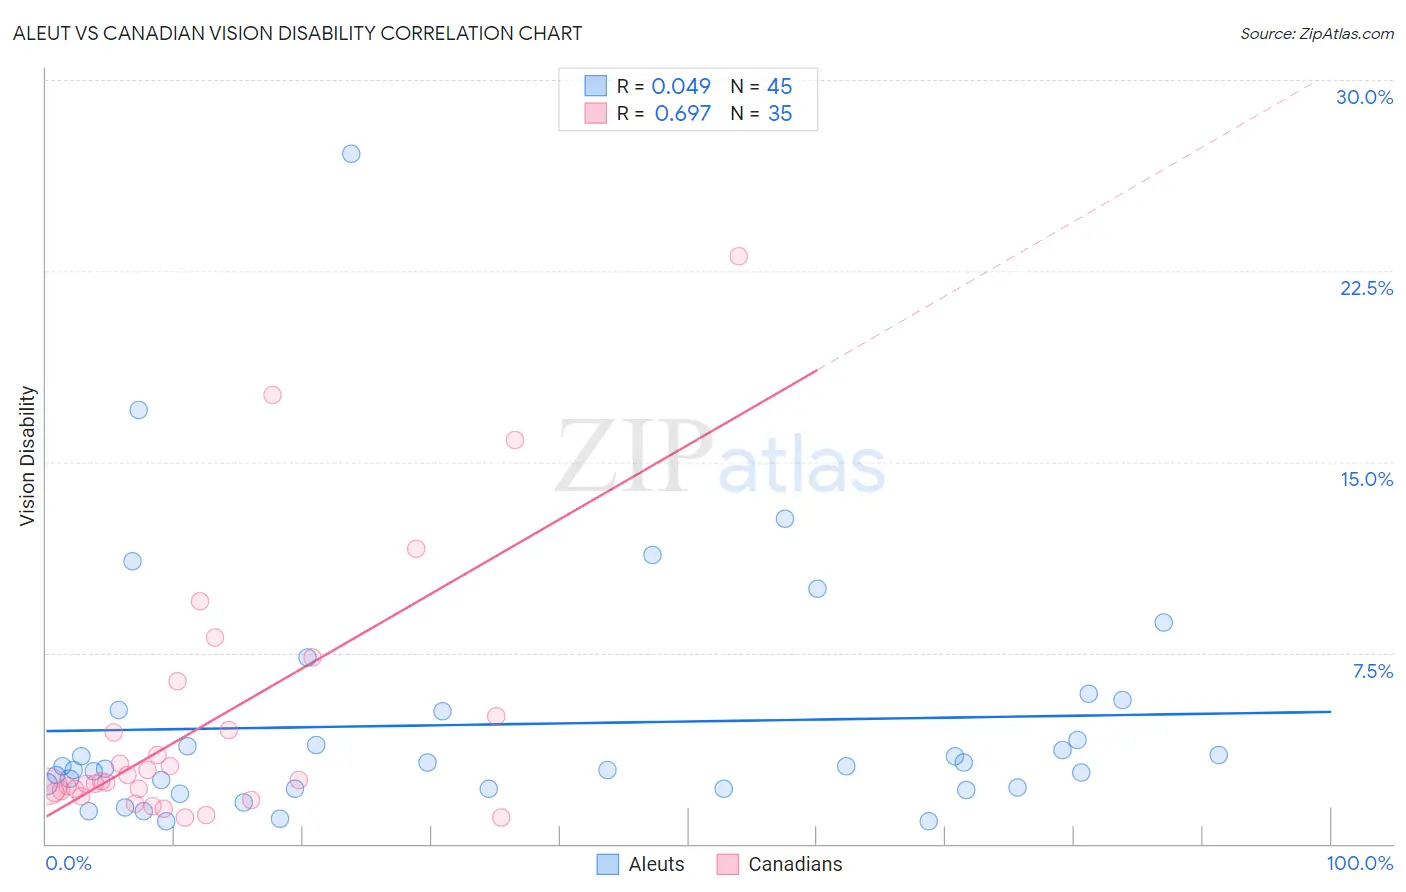
Aleut vs Canadian Vision Disability Correlation Chart
The statistical analysis conducted on geographies consisting of 61,773,801 people shows no correlation between the proportion of Aleuts and percentage of population with vision disability in the United States with a correlation coefficient (R) of 0.049 and weighted average of 2.6%. Similarly, the statistical analysis conducted on geographies consisting of 437,069,200 people shows a significant positive correlation between the proportion of Canadians and percentage of population with vision disability in the United States with a correlation coefficient (R) of 0.697 and weighted average of 2.2%, a difference of 17.4%.
Vision Disability Correlation Summary
| Measurement | Aleut | Canadian |
| Minimum | 0.87% | 1.0% |
| Maximum | 27.1% | 23.1% |
| Range | 26.2% | 22.0% |
| Mean | 4.7% | 4.7% |
| Median | 3.0% | 2.4% |
| Interquartile 25% (IQ1) | 2.2% | 2.0% |
| Interquartile 75% (IQ3) | 5.2% | 5.0% |
| Interquartile Range (IQR) | 3.1% | 3.0% |
| Standard Deviation (Sample) | 4.9% | 5.1% |
| Standard Deviation (Population) | 4.8% | 5.0% |
Similar Demographics by Vision Disability
Demographics Similar to Aleuts by Vision Disability
In terms of vision disability, the demographic groups most similar to Aleuts are Immigrants from Cabo Verde (2.6%, a difference of 0.13%), Hispanic or Latino (2.6%, a difference of 0.30%), Spanish American Indian (2.6%, a difference of 0.36%), Iroquois (2.6%, a difference of 0.91%), and Immigrants from Dominican Republic (2.6%, a difference of 0.94%).
| Demographics | Rating | Rank | Vision Disability |
| Immigrants | Dominica | 0.0 /100 | #297 | Tragic 2.5% |
| Mexicans | 0.0 /100 | #298 | Tragic 2.5% |
| Cree | 0.0 /100 | #299 | Tragic 2.5% |
| Africans | 0.0 /100 | #300 | Tragic 2.5% |
| Menominee | 0.0 /100 | #301 | Tragic 2.5% |
| Spanish American Indians | 0.0 /100 | #302 | Tragic 2.6% |
| Immigrants | Cabo Verde | 0.0 /100 | #303 | Tragic 2.6% |
| Aleuts | 0.0 /100 | #304 | Tragic 2.6% |
| Hispanics or Latinos | 0.0 /100 | #305 | Tragic 2.6% |
| Iroquois | 0.0 /100 | #306 | Tragic 2.6% |
| Immigrants | Dominican Republic | 0.0 /100 | #307 | Tragic 2.6% |
| Arapaho | 0.0 /100 | #308 | Tragic 2.6% |
| Immigrants | Yemen | 0.0 /100 | #309 | Tragic 2.6% |
| Blackfeet | 0.0 /100 | #310 | Tragic 2.6% |
| Dominicans | 0.0 /100 | #311 | Tragic 2.6% |
Demographics Similar to Canadians by Vision Disability
In terms of vision disability, the demographic groups most similar to Canadians are European (2.2%, a difference of 0.010%), Immigrants from Costa Rica (2.2%, a difference of 0.020%), British (2.2%, a difference of 0.060%), Salvadoran (2.2%, a difference of 0.13%), and Immigrants from Barbados (2.2%, a difference of 0.15%).
| Demographics | Rating | Rank | Vision Disability |
| Moroccans | 35.4 /100 | #184 | Fair 2.2% |
| Immigrants | Middle Africa | 33.5 /100 | #185 | Fair 2.2% |
| Native Hawaiians | 33.3 /100 | #186 | Fair 2.2% |
| Immigrants | St. Vincent and the Grenadines | 30.3 /100 | #187 | Fair 2.2% |
| Guyanese | 28.9 /100 | #188 | Fair 2.2% |
| Salvadorans | 27.4 /100 | #189 | Fair 2.2% |
| Immigrants | Costa Rica | 26.1 /100 | #190 | Fair 2.2% |
| Canadians | 25.8 /100 | #191 | Fair 2.2% |
| Europeans | 25.7 /100 | #192 | Fair 2.2% |
| British | 25.1 /100 | #193 | Fair 2.2% |
| Immigrants | Barbados | 24.0 /100 | #194 | Fair 2.2% |
| Immigrants | Immigrants | 23.7 /100 | #195 | Fair 2.2% |
| Immigrants | Grenada | 23.1 /100 | #196 | Fair 2.2% |
| Ghanaians | 21.8 /100 | #197 | Fair 2.2% |
| Czechoslovakians | 21.6 /100 | #198 | Fair 2.2% |