Immigrants from Lithuania vs Basque Householder Income Under 25 years
COMPARE
Immigrants from Lithuania
Basque
Householder Income Under 25 years
Householder Income Under 25 years Comparison
Immigrants from Lithuania
Basques
$55,028
HOUSEHOLDER INCOME UNDER 25 YEARS
99.9/ 100
METRIC RATING
60th/ 347
METRIC RANK
$51,818
HOUSEHOLDER INCOME UNDER 25 YEARS
28.7/ 100
METRIC RATING
179th/ 347
METRIC RANK
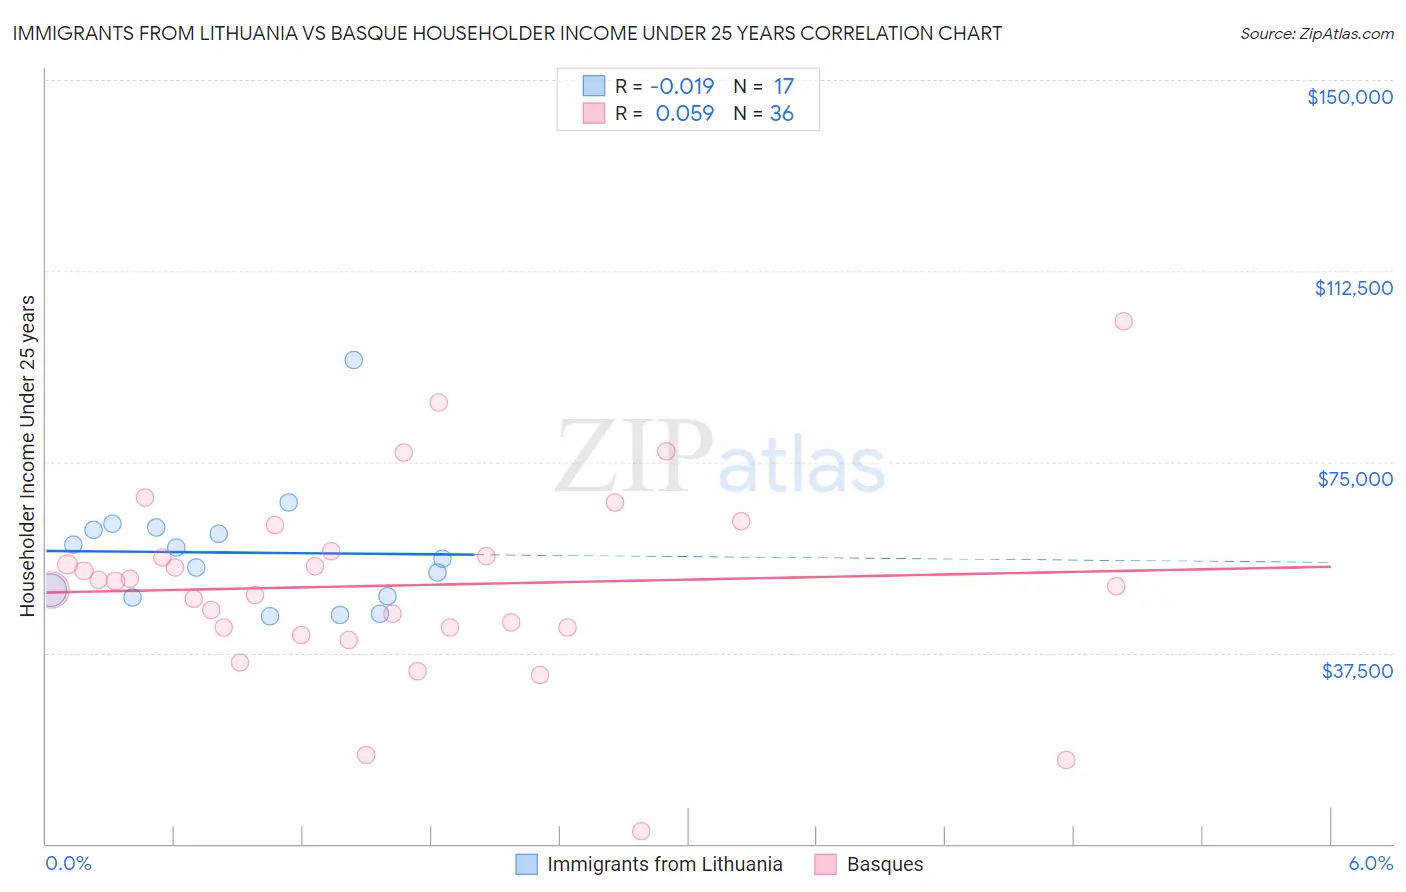
Immigrants from Lithuania vs Basque Householder Income Under 25 years Correlation Chart
The statistical analysis conducted on geographies consisting of 105,974,448 people shows no correlation between the proportion of Immigrants from Lithuania and household income with householder under the age of 25 in the United States with a correlation coefficient (R) of -0.019 and weighted average of $55,028. Similarly, the statistical analysis conducted on geographies consisting of 150,470,648 people shows a slight positive correlation between the proportion of Basques and household income with householder under the age of 25 in the United States with a correlation coefficient (R) of 0.059 and weighted average of $51,818, a difference of 6.2%.
Householder Income Under 25 years Correlation Summary
| Measurement | Immigrants from Lithuania | Basque |
| Minimum | $44,601 | $2,499 |
| Maximum | $94,977 | $102,571 |
| Range | $50,376 | $100,072 |
| Mean | $57,170 | $50,731 |
| Median | $56,042 | $51,007 |
| Interquartile 25% (IQ1) | $48,432 | $42,540 |
| Interquartile 75% (IQ3) | $61,949 | $57,010 |
| Interquartile Range (IQR) | $13,518 | $14,470 |
| Standard Deviation (Sample) | $11,998 | $18,783 |
| Standard Deviation (Population) | $11,640 | $18,521 |
Similar Demographics by Householder Income Under 25 years
Demographics Similar to Immigrants from Lithuania by Householder Income Under 25 years
In terms of householder income under 25 years, the demographic groups most similar to Immigrants from Lithuania are Immigrants from Europe ($55,022, a difference of 0.010%), Native Hawaiian ($55,158, a difference of 0.24%), Guyanese ($55,210, a difference of 0.33%), Immigrants from Uzbekistan ($54,846, a difference of 0.33%), and Immigrants from Belgium ($54,830, a difference of 0.36%).
| Demographics | Rating | Rank | Householder Income Under 25 years |
| Immigrants | Poland | 100.0 /100 | #53 | Exceptional $55,474 |
| Sri Lankans | 100.0 /100 | #54 | Exceptional $55,470 |
| Immigrants | Ukraine | 100.0 /100 | #55 | Exceptional $55,447 |
| Salvadorans | 100.0 /100 | #56 | Exceptional $55,412 |
| Soviet Union | 100.0 /100 | #57 | Exceptional $55,340 |
| Guyanese | 99.9 /100 | #58 | Exceptional $55,210 |
| Native Hawaiians | 99.9 /100 | #59 | Exceptional $55,158 |
| Immigrants | Lithuania | 99.9 /100 | #60 | Exceptional $55,028 |
| Immigrants | Europe | 99.9 /100 | #61 | Exceptional $55,022 |
| Immigrants | Uzbekistan | 99.8 /100 | #62 | Exceptional $54,846 |
| Immigrants | Belgium | 99.8 /100 | #63 | Exceptional $54,830 |
| Burmese | 99.8 /100 | #64 | Exceptional $54,800 |
| Yup'ik | 99.8 /100 | #65 | Exceptional $54,732 |
| Immigrants | Bangladesh | 99.8 /100 | #66 | Exceptional $54,714 |
| Okinawans | 99.8 /100 | #67 | Exceptional $54,701 |
Demographics Similar to Basques by Householder Income Under 25 years
In terms of householder income under 25 years, the demographic groups most similar to Basques are Immigrants from England ($51,817, a difference of 0.0%), Finnish ($51,827, a difference of 0.020%), European ($51,796, a difference of 0.040%), Jordanian ($51,796, a difference of 0.040%), and British West Indian ($51,844, a difference of 0.050%).
| Demographics | Rating | Rank | Householder Income Under 25 years |
| Cypriots | 51.2 /100 | #172 | Average $52,209 |
| Barbadians | 50.8 /100 | #173 | Average $52,202 |
| Immigrants | Western Asia | 50.0 /100 | #174 | Average $52,190 |
| Immigrants | Zimbabwe | 33.8 /100 | #175 | Fair $51,914 |
| Austrians | 32.9 /100 | #176 | Fair $51,898 |
| British West Indians | 30.0 /100 | #177 | Fair $51,844 |
| Finns | 29.2 /100 | #178 | Fair $51,827 |
| Basques | 28.7 /100 | #179 | Fair $51,818 |
| Immigrants | England | 28.7 /100 | #180 | Fair $51,817 |
| Europeans | 27.6 /100 | #181 | Fair $51,796 |
| Jordanians | 27.6 /100 | #182 | Fair $51,796 |
| Mexican American Indians | 27.0 /100 | #183 | Fair $51,783 |
| Paiute | 25.1 /100 | #184 | Fair $51,743 |
| Immigrants | Latvia | 24.8 /100 | #185 | Fair $51,737 |
| Alaskan Athabascans | 23.8 /100 | #186 | Fair $51,713 |