Immigrants from Lithuania vs Sioux Male Disability
COMPARE
Immigrants from Lithuania
Sioux
Male Disability
Male Disability Comparison
Immigrants from Lithuania
Sioux
10.5%
MALE DISABILITY
98.9/ 100
METRIC RATING
73rd/ 347
METRIC RANK
12.7%
MALE DISABILITY
0.0/ 100
METRIC RATING
281st/ 347
METRIC RANK
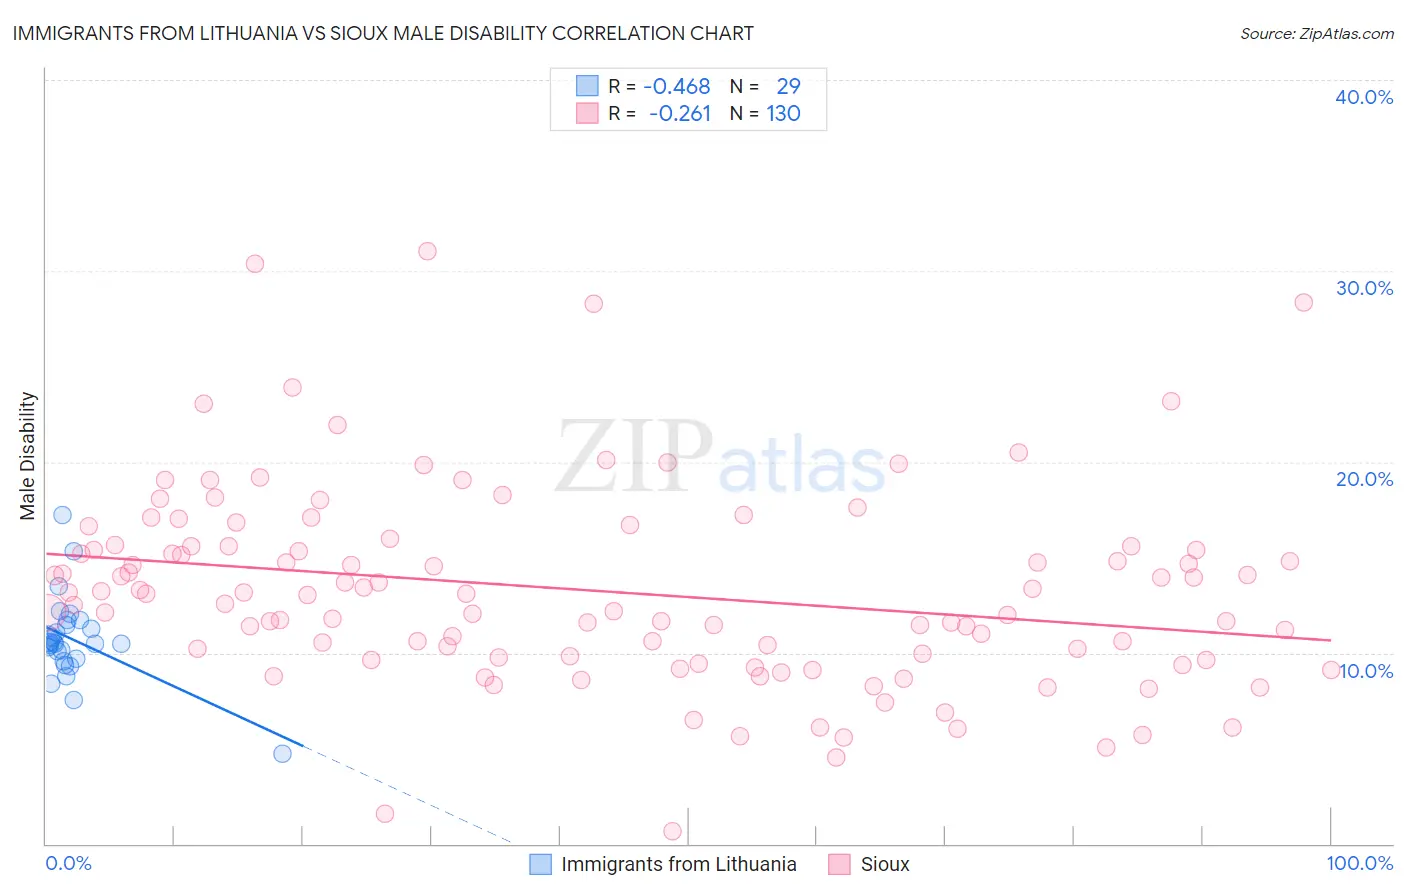
Immigrants from Lithuania vs Sioux Male Disability Correlation Chart
The statistical analysis conducted on geographies consisting of 117,723,039 people shows a moderate negative correlation between the proportion of Immigrants from Lithuania and percentage of males with a disability in the United States with a correlation coefficient (R) of -0.468 and weighted average of 10.5%. Similarly, the statistical analysis conducted on geographies consisting of 234,137,085 people shows a weak negative correlation between the proportion of Sioux and percentage of males with a disability in the United States with a correlation coefficient (R) of -0.261 and weighted average of 12.7%, a difference of 20.8%.
Male Disability Correlation Summary
| Measurement | Immigrants from Lithuania | Sioux |
| Minimum | 4.7% | 0.66% |
| Maximum | 17.2% | 31.1% |
| Range | 12.5% | 30.4% |
| Mean | 10.7% | 13.2% |
| Median | 10.5% | 13.1% |
| Interquartile 25% (IQ1) | 9.6% | 9.8% |
| Interquartile 75% (IQ3) | 11.6% | 15.6% |
| Interquartile Range (IQR) | 2.0% | 5.8% |
| Standard Deviation (Sample) | 2.2% | 5.2% |
| Standard Deviation (Population) | 2.2% | 5.2% |
Similar Demographics by Male Disability
Demographics Similar to Immigrants from Lithuania by Male Disability
In terms of male disability, the demographic groups most similar to Immigrants from Lithuania are Immigrants from Serbia (10.5%, a difference of 0.060%), Immigrants from Cameroon (10.5%, a difference of 0.12%), Immigrants from Lebanon (10.5%, a difference of 0.14%), Sierra Leonean (10.5%, a difference of 0.26%), and Immigrants from Bulgaria (10.5%, a difference of 0.27%).
| Demographics | Rating | Rank | Male Disability |
| Guyanese | 99.2 /100 | #66 | Exceptional 10.5% |
| Immigrants | Afghanistan | 99.2 /100 | #67 | Exceptional 10.5% |
| Colombians | 99.2 /100 | #68 | Exceptional 10.5% |
| Ecuadorians | 99.2 /100 | #69 | Exceptional 10.5% |
| Immigrants | Bulgaria | 99.1 /100 | #70 | Exceptional 10.5% |
| Immigrants | Cameroon | 99.0 /100 | #71 | Exceptional 10.5% |
| Immigrants | Serbia | 99.0 /100 | #72 | Exceptional 10.5% |
| Immigrants | Lithuania | 98.9 /100 | #73 | Exceptional 10.5% |
| Immigrants | Lebanon | 98.8 /100 | #74 | Exceptional 10.5% |
| Sierra Leoneans | 98.7 /100 | #75 | Exceptional 10.5% |
| Immigrants | Sierra Leone | 98.7 /100 | #76 | Exceptional 10.5% |
| Laotians | 98.6 /100 | #77 | Exceptional 10.6% |
| Immigrants | Russia | 98.6 /100 | #78 | Exceptional 10.6% |
| Zimbabweans | 98.4 /100 | #79 | Exceptional 10.6% |
| Immigrants | Jordan | 98.4 /100 | #80 | Exceptional 10.6% |
Demographics Similar to Sioux by Male Disability
In terms of male disability, the demographic groups most similar to Sioux are Dutch (12.7%, a difference of 0.060%), Irish (12.7%, a difference of 0.060%), German (12.7%, a difference of 0.070%), Slovak (12.7%, a difference of 0.11%), and Central American Indian (12.7%, a difference of 0.26%).
| Demographics | Rating | Rank | Male Disability |
| Hopi | 0.0 /100 | #274 | Tragic 12.5% |
| Fijians | 0.0 /100 | #275 | Tragic 12.6% |
| Africans | 0.0 /100 | #276 | Tragic 12.6% |
| Finns | 0.0 /100 | #277 | Tragic 12.6% |
| Central American Indians | 0.0 /100 | #278 | Tragic 12.7% |
| Slovaks | 0.0 /100 | #279 | Tragic 12.7% |
| Dutch | 0.0 /100 | #280 | Tragic 12.7% |
| Sioux | 0.0 /100 | #281 | Tragic 12.7% |
| Irish | 0.0 /100 | #282 | Tragic 12.7% |
| Germans | 0.0 /100 | #283 | Tragic 12.7% |
| Spanish | 0.0 /100 | #284 | Tragic 12.7% |
| Welsh | 0.0 /100 | #285 | Tragic 12.7% |
| Scottish | 0.0 /100 | #286 | Tragic 12.8% |
| Cape Verdeans | 0.0 /100 | #287 | Tragic 12.8% |
| Yup'ik | 0.0 /100 | #288 | Tragic 12.8% |