Immigrants from Latvia vs Immigrants from Greece Self-Care Disability
COMPARE
Immigrants from Latvia
Immigrants from Greece
Self-Care Disability
Self-Care Disability Comparison
Immigrants from Latvia
Immigrants from Greece
2.4%
SELF-CARE DISABILITY
97.0/ 100
METRIC RATING
93rd/ 347
METRIC RANK
2.5%
SELF-CARE DISABILITY
57.3/ 100
METRIC RATING
167th/ 347
METRIC RANK
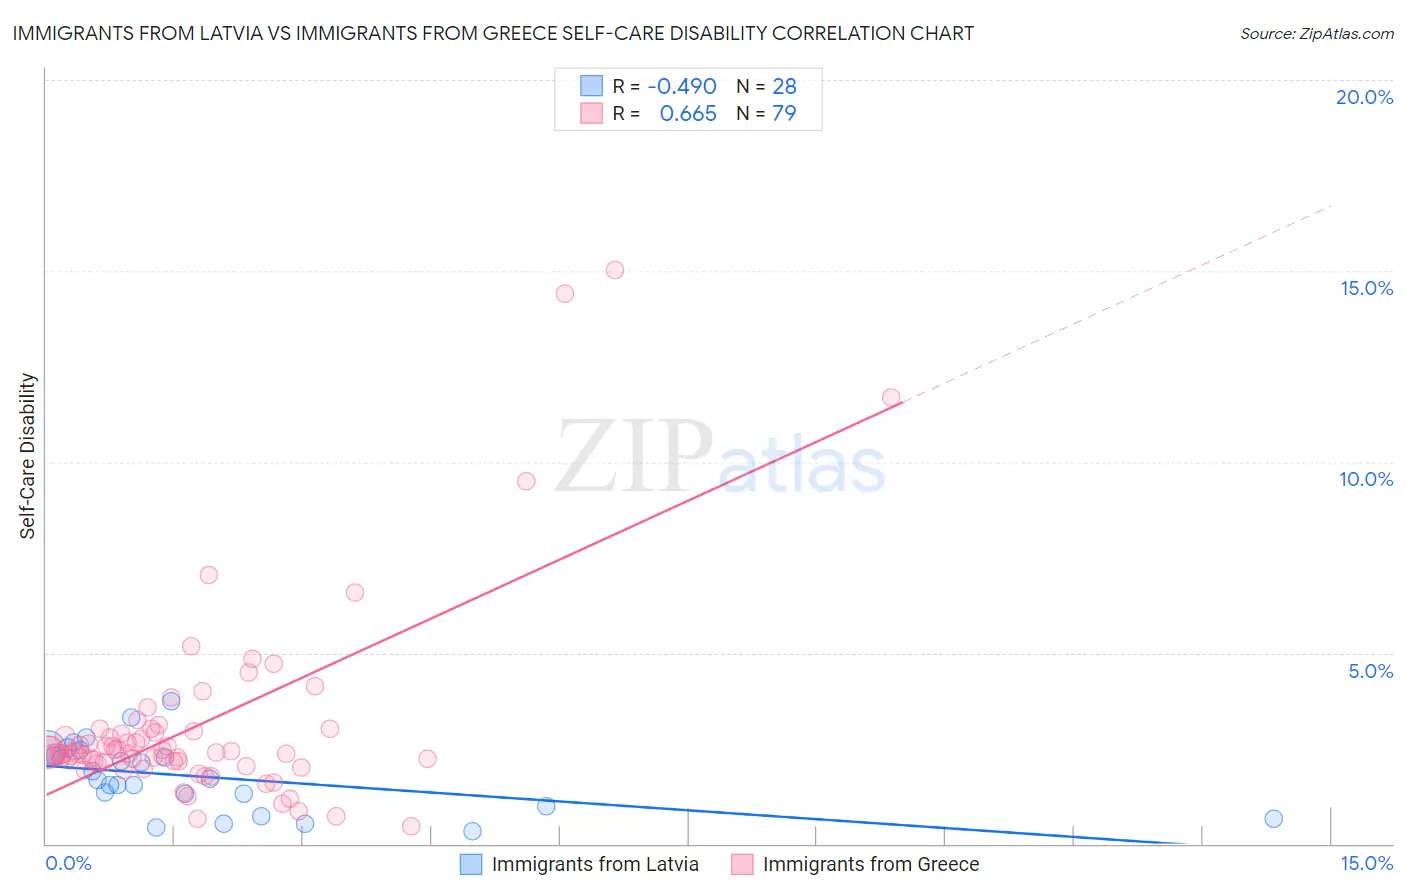
Immigrants from Latvia vs Immigrants from Greece Self-Care Disability Correlation Chart
The statistical analysis conducted on geographies consisting of 113,697,152 people shows a moderate negative correlation between the proportion of Immigrants from Latvia and percentage of population with self-care disability in the United States with a correlation coefficient (R) of -0.490 and weighted average of 2.4%. Similarly, the statistical analysis conducted on geographies consisting of 216,801,636 people shows a significant positive correlation between the proportion of Immigrants from Greece and percentage of population with self-care disability in the United States with a correlation coefficient (R) of 0.665 and weighted average of 2.5%, a difference of 4.0%.
Self-Care Disability Correlation Summary
| Measurement | Immigrants from Latvia | Immigrants from Greece |
| Minimum | 0.33% | 0.45% |
| Maximum | 3.7% | 15.0% |
| Range | 3.4% | 14.6% |
| Mean | 1.8% | 3.1% |
| Median | 1.7% | 2.4% |
| Interquartile 25% (IQ1) | 1.1% | 2.1% |
| Interquartile 75% (IQ3) | 2.4% | 2.9% |
| Interquartile Range (IQR) | 1.2% | 0.81% |
| Standard Deviation (Sample) | 0.89% | 2.5% |
| Standard Deviation (Population) | 0.87% | 2.5% |
Similar Demographics by Self-Care Disability
Demographics Similar to Immigrants from Latvia by Self-Care Disability
In terms of self-care disability, the demographic groups most similar to Immigrants from Latvia are Macedonian (2.4%, a difference of 0.040%), Immigrants from Asia (2.4%, a difference of 0.050%), Immigrants from Chile (2.4%, a difference of 0.11%), Swiss (2.4%, a difference of 0.16%), and Icelander (2.4%, a difference of 0.19%).
| Demographics | Rating | Rank | Self-Care Disability |
| Immigrants | Northern Africa | 98.2 /100 | #86 | Exceptional 2.3% |
| Sierra Leoneans | 98.0 /100 | #87 | Exceptional 2.4% |
| Lithuanians | 98.0 /100 | #88 | Exceptional 2.4% |
| Immigrants | Congo | 98.0 /100 | #89 | Exceptional 2.4% |
| Immigrants | Czechoslovakia | 97.7 /100 | #90 | Exceptional 2.4% |
| Immigrants | Jordan | 97.7 /100 | #91 | Exceptional 2.4% |
| Icelanders | 97.4 /100 | #92 | Exceptional 2.4% |
| Immigrants | Latvia | 97.0 /100 | #93 | Exceptional 2.4% |
| Macedonians | 96.9 /100 | #94 | Exceptional 2.4% |
| Immigrants | Asia | 96.9 /100 | #95 | Exceptional 2.4% |
| Immigrants | Chile | 96.7 /100 | #96 | Exceptional 2.4% |
| Swiss | 96.6 /100 | #97 | Exceptional 2.4% |
| Immigrants | Poland | 96.4 /100 | #98 | Exceptional 2.4% |
| Immigrants | Israel | 96.1 /100 | #99 | Exceptional 2.4% |
| Europeans | 95.8 /100 | #100 | Exceptional 2.4% |
Demographics Similar to Immigrants from Greece by Self-Care Disability
In terms of self-care disability, the demographic groups most similar to Immigrants from Greece are Ute (2.5%, a difference of 0.010%), Canadian (2.5%, a difference of 0.070%), Immigrants from Somalia (2.5%, a difference of 0.070%), Syrian (2.5%, a difference of 0.080%), and Immigrants from Vietnam (2.5%, a difference of 0.10%).
| Demographics | Rating | Rank | Self-Care Disability |
| Finns | 67.0 /100 | #160 | Good 2.4% |
| Lebanese | 66.5 /100 | #161 | Good 2.4% |
| Somalis | 63.7 /100 | #162 | Good 2.5% |
| German Russians | 62.7 /100 | #163 | Good 2.5% |
| Immigrants | Vietnam | 59.3 /100 | #164 | Average 2.5% |
| Syrians | 59.0 /100 | #165 | Average 2.5% |
| Canadians | 58.8 /100 | #166 | Average 2.5% |
| Immigrants | Greece | 57.3 /100 | #167 | Average 2.5% |
| Ute | 57.1 /100 | #168 | Average 2.5% |
| Immigrants | Somalia | 55.9 /100 | #169 | Average 2.5% |
| Scottish | 54.3 /100 | #170 | Average 2.5% |
| Pennsylvania Germans | 53.5 /100 | #171 | Average 2.5% |
| Czechoslovakians | 53.5 /100 | #172 | Average 2.5% |
| Immigrants | Burma/Myanmar | 52.8 /100 | #173 | Average 2.5% |
| Welsh | 50.0 /100 | #174 | Average 2.5% |