Alaska Native vs Immigrants from Grenada Disability Age Over 75
COMPARE
Alaska Native
Immigrants from Grenada
Disability Age Over 75
Disability Age Over 75 Comparison
Alaska Natives
Immigrants from Grenada
52.8%
DISABILITY AGE OVER 75
0.0/ 100
METRIC RATING
329th/ 347
METRIC RANK
47.9%
DISABILITY AGE OVER 75
9.4/ 100
METRIC RATING
217th/ 347
METRIC RANK
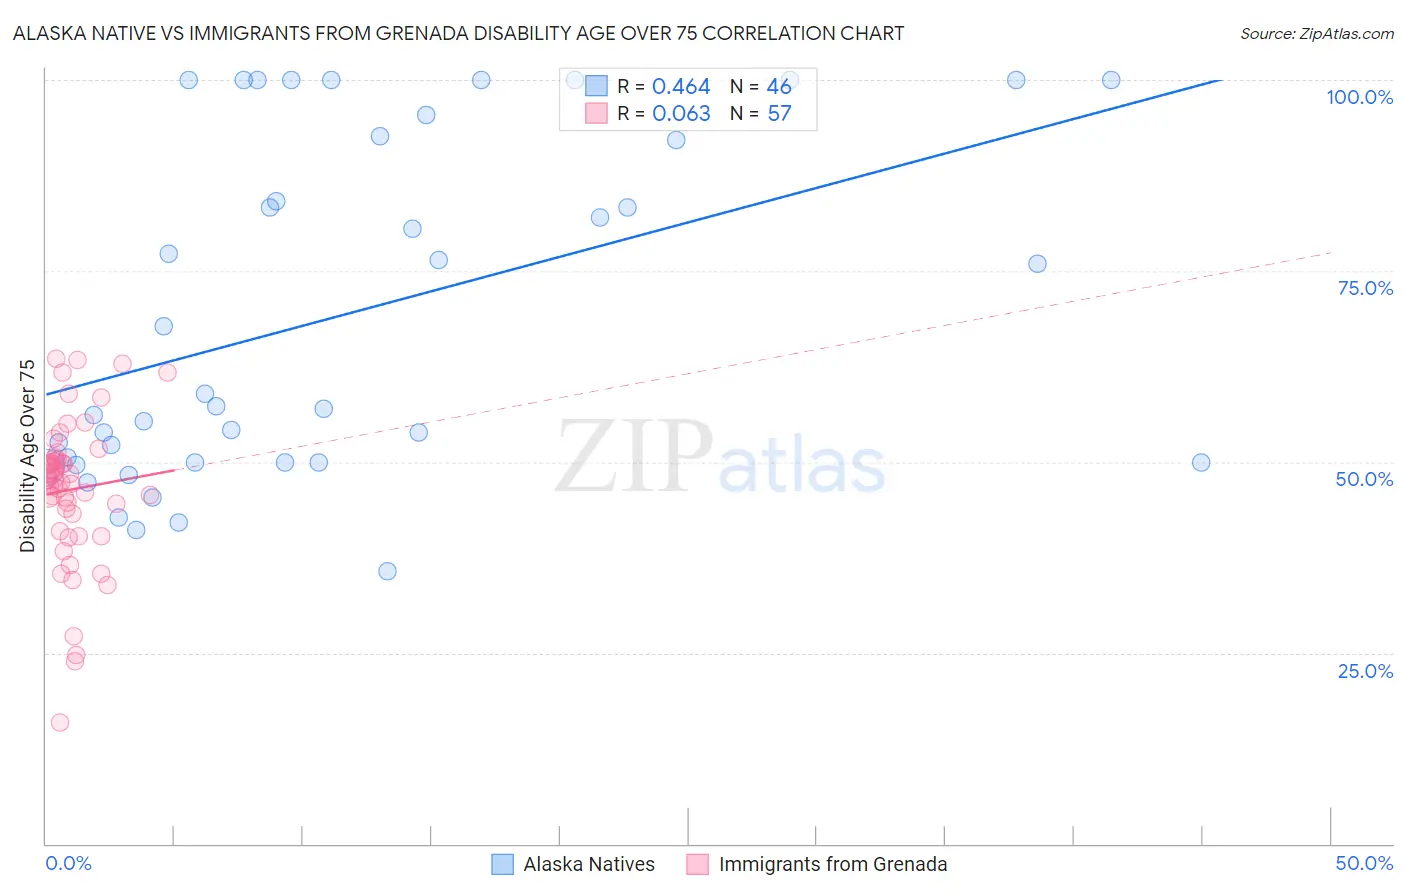
Alaska Native vs Immigrants from Grenada Disability Age Over 75 Correlation Chart
The statistical analysis conducted on geographies consisting of 76,686,010 people shows a moderate positive correlation between the proportion of Alaska Natives and percentage of population with a disability over the age of 75 in the United States with a correlation coefficient (R) of 0.464 and weighted average of 52.8%. Similarly, the statistical analysis conducted on geographies consisting of 67,162,084 people shows a slight positive correlation between the proportion of Immigrants from Grenada and percentage of population with a disability over the age of 75 in the United States with a correlation coefficient (R) of 0.063 and weighted average of 47.9%, a difference of 10.1%.
Disability Age Over 75 Correlation Summary
| Measurement | Alaska Native | Immigrants from Grenada |
| Minimum | 35.7% | 15.8% |
| Maximum | 100.0% | 63.4% |
| Range | 64.3% | 47.6% |
| Mean | 69.4% | 46.4% |
| Median | 58.1% | 47.7% |
| Interquartile 25% (IQ1) | 50.0% | 42.1% |
| Interquartile 75% (IQ3) | 92.6% | 50.4% |
| Interquartile Range (IQR) | 42.6% | 8.3% |
| Standard Deviation (Sample) | 22.0% | 9.6% |
| Standard Deviation (Population) | 21.8% | 9.6% |
Similar Demographics by Disability Age Over 75
Demographics Similar to Alaska Natives by Disability Age Over 75
In terms of disability age over 75, the demographic groups most similar to Alaska Natives are Puerto Rican (52.9%, a difference of 0.18%), Hopi (52.9%, a difference of 0.19%), Choctaw (52.7%, a difference of 0.22%), Nepalese (52.6%, a difference of 0.41%), and Ute (52.6%, a difference of 0.44%).
| Demographics | Rating | Rank | Disability Age Over 75 |
| Comanche | 0.0 /100 | #322 | Tragic 51.7% |
| Immigrants | Yemen | 0.0 /100 | #323 | Tragic 52.0% |
| Menominee | 0.0 /100 | #324 | Tragic 52.3% |
| Immigrants | Cabo Verde | 0.0 /100 | #325 | Tragic 52.4% |
| Ute | 0.0 /100 | #326 | Tragic 52.6% |
| Nepalese | 0.0 /100 | #327 | Tragic 52.6% |
| Choctaw | 0.0 /100 | #328 | Tragic 52.7% |
| Alaska Natives | 0.0 /100 | #329 | Tragic 52.8% |
| Puerto Ricans | 0.0 /100 | #330 | Tragic 52.9% |
| Hopi | 0.0 /100 | #331 | Tragic 52.9% |
| Natives/Alaskans | 0.0 /100 | #332 | Tragic 53.1% |
| Apache | 0.0 /100 | #333 | Tragic 53.6% |
| Alaskan Athabascans | 0.0 /100 | #334 | Tragic 54.0% |
| Kiowa | 0.0 /100 | #335 | Tragic 54.2% |
| Immigrants | Armenia | 0.0 /100 | #336 | Tragic 54.3% |
Demographics Similar to Immigrants from Grenada by Disability Age Over 75
In terms of disability age over 75, the demographic groups most similar to Immigrants from Grenada are Immigrants from Panama (47.9%, a difference of 0.050%), Immigrants from Western Africa (48.0%, a difference of 0.070%), Immigrants from Barbados (47.9%, a difference of 0.080%), Senegalese (47.9%, a difference of 0.080%), and Laotian (47.9%, a difference of 0.12%).
| Demographics | Rating | Rank | Disability Age Over 75 |
| Vietnamese | 11.9 /100 | #210 | Poor 47.9% |
| Panamanians | 11.8 /100 | #211 | Poor 47.9% |
| Immigrants | Burma/Myanmar | 11.7 /100 | #212 | Poor 47.9% |
| Laotians | 11.5 /100 | #213 | Poor 47.9% |
| Immigrants | Barbados | 10.7 /100 | #214 | Poor 47.9% |
| Senegalese | 10.7 /100 | #215 | Poor 47.9% |
| Immigrants | Panama | 10.2 /100 | #216 | Poor 47.9% |
| Immigrants | Grenada | 9.4 /100 | #217 | Tragic 47.9% |
| Immigrants | Western Africa | 8.3 /100 | #218 | Tragic 48.0% |
| Immigrants | Western Asia | 7.5 /100 | #219 | Tragic 48.0% |
| Bahamians | 7.4 /100 | #220 | Tragic 48.0% |
| Immigrants | Oceania | 7.3 /100 | #221 | Tragic 48.0% |
| Barbadians | 6.8 /100 | #222 | Tragic 48.0% |
| Immigrants | Bangladesh | 6.8 /100 | #223 | Tragic 48.0% |
| Liberians | 6.7 /100 | #224 | Tragic 48.0% |