U.S. Virgin Islander vs Afghan Female Disability
COMPARE
U.S. Virgin Islander
Afghan
Female Disability
Female Disability Comparison
U.S. Virgin Islanders
Afghans
13.1%
FEMALE DISABILITY
0.1/ 100
METRIC RATING
281st/ 347
METRIC RANK
11.2%
FEMALE DISABILITY
100.0/ 100
METRIC RATING
43rd/ 347
METRIC RANK
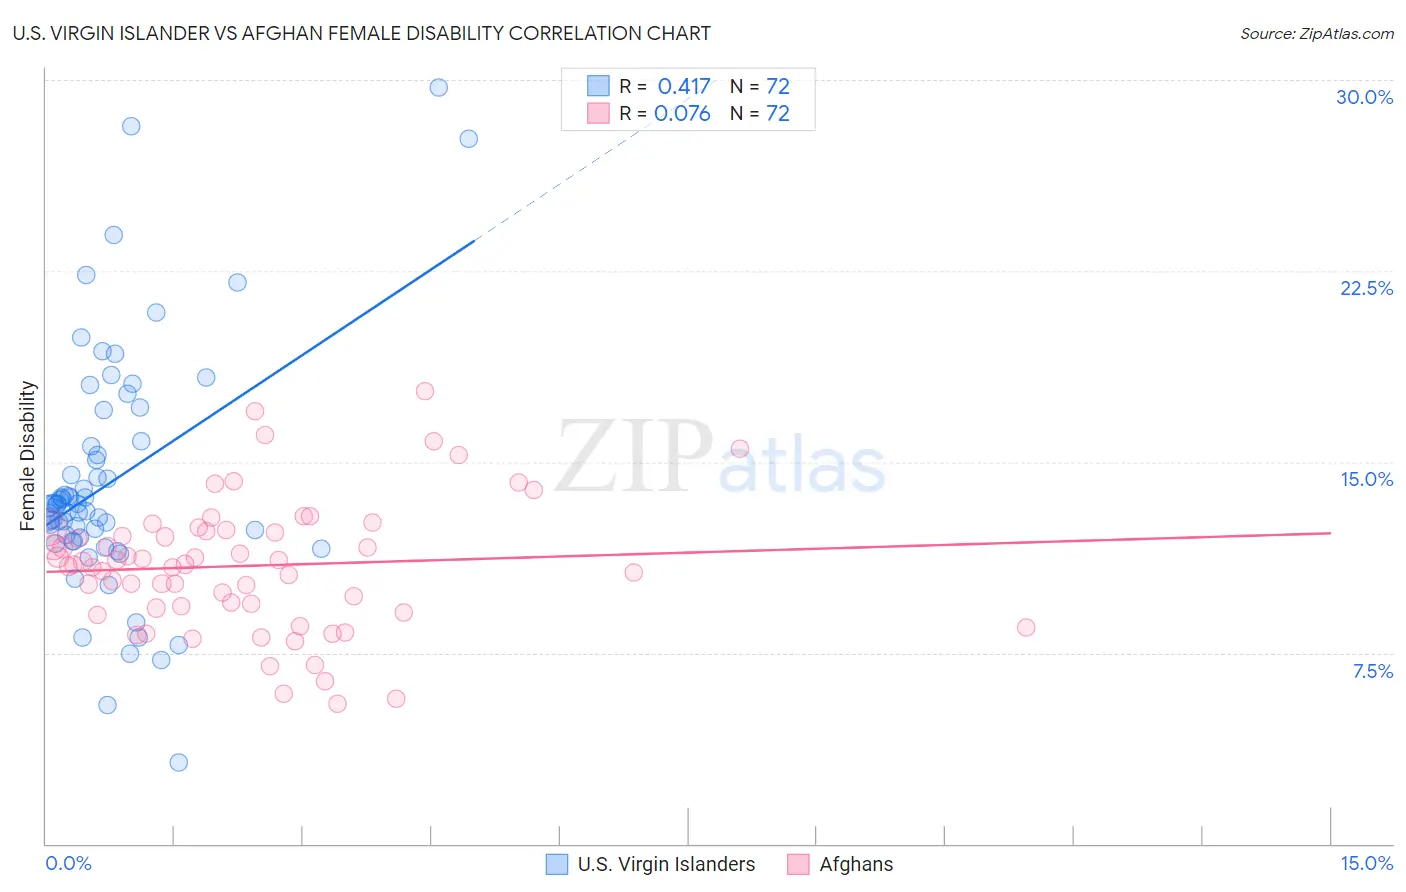
U.S. Virgin Islander vs Afghan Female Disability Correlation Chart
The statistical analysis conducted on geographies consisting of 87,518,599 people shows a moderate positive correlation between the proportion of U.S. Virgin Islanders and percentage of females with a disability in the United States with a correlation coefficient (R) of 0.417 and weighted average of 13.1%. Similarly, the statistical analysis conducted on geographies consisting of 148,868,441 people shows a slight positive correlation between the proportion of Afghans and percentage of females with a disability in the United States with a correlation coefficient (R) of 0.076 and weighted average of 11.2%, a difference of 16.2%.
Female Disability Correlation Summary
| Measurement | U.S. Virgin Islander | Afghan |
| Minimum | 3.2% | 5.5% |
| Maximum | 29.7% | 17.8% |
| Range | 26.5% | 12.3% |
| Mean | 14.2% | 10.9% |
| Median | 13.3% | 11.0% |
| Interquartile 25% (IQ1) | 12.0% | 9.3% |
| Interquartile 75% (IQ3) | 15.7% | 12.3% |
| Interquartile Range (IQR) | 3.8% | 3.0% |
| Standard Deviation (Sample) | 4.8% | 2.6% |
| Standard Deviation (Population) | 4.8% | 2.6% |
Similar Demographics by Female Disability
Demographics Similar to U.S. Virgin Islanders by Female Disability
In terms of female disability, the demographic groups most similar to U.S. Virgin Islanders are Irish (13.1%, a difference of 0.030%), Welsh (13.1%, a difference of 0.080%), English (13.1%, a difference of 0.080%), Arapaho (13.0%, a difference of 0.12%), and Hmong (13.1%, a difference of 0.22%).
| Demographics | Rating | Rank | Female Disability |
| Portuguese | 0.1 /100 | #274 | Tragic 13.0% |
| Cheyenne | 0.1 /100 | #275 | Tragic 13.0% |
| Immigrants | Dominica | 0.1 /100 | #276 | Tragic 13.0% |
| Spanish | 0.1 /100 | #277 | Tragic 13.0% |
| Scottish | 0.1 /100 | #278 | Tragic 13.0% |
| Arapaho | 0.1 /100 | #279 | Tragic 13.0% |
| Irish | 0.1 /100 | #280 | Tragic 13.1% |
| U.S. Virgin Islanders | 0.1 /100 | #281 | Tragic 13.1% |
| Welsh | 0.0 /100 | #282 | Tragic 13.1% |
| English | 0.0 /100 | #283 | Tragic 13.1% |
| Hmong | 0.0 /100 | #284 | Tragic 13.1% |
| Bangladeshis | 0.0 /100 | #285 | Tragic 13.1% |
| Fijians | 0.0 /100 | #286 | Tragic 13.1% |
| Yaqui | 0.0 /100 | #287 | Tragic 13.2% |
| Whites/Caucasians | 0.0 /100 | #288 | Tragic 13.2% |
Demographics Similar to Afghans by Female Disability
In terms of female disability, the demographic groups most similar to Afghans are Israeli (11.2%, a difference of 0.030%), Paraguayan (11.2%, a difference of 0.12%), Mongolian (11.2%, a difference of 0.14%), Immigrants from Lithuania (11.2%, a difference of 0.17%), and Cambodian (11.3%, a difference of 0.20%).
| Demographics | Rating | Rank | Female Disability |
| Cypriots | 100.0 /100 | #36 | Exceptional 11.2% |
| Ethiopians | 100.0 /100 | #37 | Exceptional 11.2% |
| Immigrants | Ethiopia | 100.0 /100 | #38 | Exceptional 11.2% |
| Immigrants | Lithuania | 100.0 /100 | #39 | Exceptional 11.2% |
| Mongolians | 100.0 /100 | #40 | Exceptional 11.2% |
| Paraguayans | 100.0 /100 | #41 | Exceptional 11.2% |
| Israelis | 100.0 /100 | #42 | Exceptional 11.2% |
| Afghans | 100.0 /100 | #43 | Exceptional 11.2% |
| Cambodians | 100.0 /100 | #44 | Exceptional 11.3% |
| Immigrants | Sweden | 100.0 /100 | #45 | Exceptional 11.3% |
| Immigrants | Nepal | 100.0 /100 | #46 | Exceptional 11.3% |
| Jordanians | 100.0 /100 | #47 | Exceptional 11.3% |
| Zimbabweans | 100.0 /100 | #48 | Exceptional 11.3% |
| Tongans | 100.0 /100 | #49 | Exceptional 11.3% |
| Inupiat | 100.0 /100 | #50 | Exceptional 11.3% |