Immigrants from Belgium vs Bhutanese Disability Age Under 5
COMPARE
Immigrants from Belgium
Bhutanese
Disability Age Under 5
Disability Age Under 5 Comparison
Immigrants from Belgium
Bhutanese
1.3%
DISABILITY AGE UNDER 5
31.4/ 100
METRIC RATING
196th/ 347
METRIC RANK
1.2%
DISABILITY AGE UNDER 5
92.5/ 100
METRIC RATING
119th/ 347
METRIC RANK
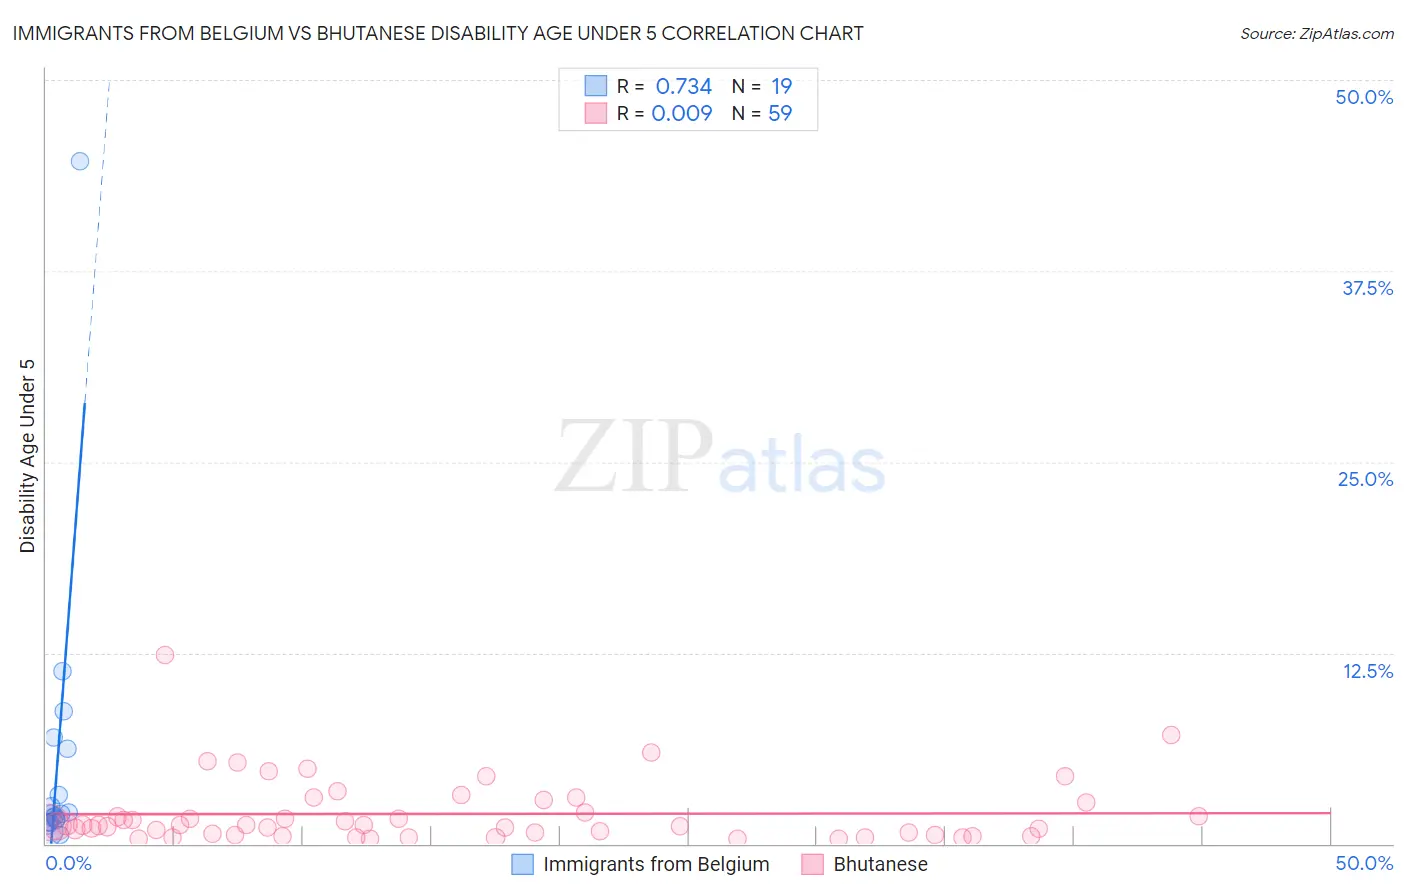
Immigrants from Belgium vs Bhutanese Disability Age Under 5 Correlation Chart
The statistical analysis conducted on geographies consisting of 103,751,035 people shows a strong positive correlation between the proportion of Immigrants from Belgium and percentage of population with a disability under the age of 5 in the United States with a correlation coefficient (R) of 0.734 and weighted average of 1.3%. Similarly, the statistical analysis conducted on geographies consisting of 235,474,976 people shows no correlation between the proportion of Bhutanese and percentage of population with a disability under the age of 5 in the United States with a correlation coefficient (R) of 0.009 and weighted average of 1.2%, a difference of 7.9%.
Disability Age Under 5 Correlation Summary
| Measurement | Immigrants from Belgium | Bhutanese |
| Minimum | 0.56% | 0.32% |
| Maximum | 44.7% | 12.3% |
| Range | 44.1% | 12.0% |
| Mean | 5.3% | 2.0% |
| Median | 1.9% | 1.2% |
| Interquartile 25% (IQ1) | 1.4% | 0.60% |
| Interquartile 75% (IQ3) | 6.2% | 2.7% |
| Interquartile Range (IQR) | 4.8% | 2.1% |
| Standard Deviation (Sample) | 10.0% | 2.1% |
| Standard Deviation (Population) | 9.7% | 2.1% |
Similar Demographics by Disability Age Under 5
Demographics Similar to Immigrants from Belgium by Disability Age Under 5
In terms of disability age under 5, the demographic groups most similar to Immigrants from Belgium are Immigrants from Somalia (1.3%, a difference of 0.010%), Immigrants from Norway (1.3%, a difference of 0.040%), Jamaican (1.3%, a difference of 0.080%), U.S. Virgin Islander (1.3%, a difference of 0.30%), and Immigrants from North Macedonia (1.3%, a difference of 0.33%).
| Demographics | Rating | Rank | Disability Age Under 5 |
| Peruvians | 37.6 /100 | #189 | Fair 1.3% |
| Immigrants | Laos | 36.6 /100 | #190 | Fair 1.3% |
| Mexican American Indians | 36.6 /100 | #191 | Fair 1.3% |
| Immigrants | Bosnia and Herzegovina | 36.5 /100 | #192 | Fair 1.3% |
| Immigrants | Sierra Leone | 36.5 /100 | #193 | Fair 1.3% |
| Immigrants | North Macedonia | 34.7 /100 | #194 | Fair 1.3% |
| U.S. Virgin Islanders | 34.4 /100 | #195 | Fair 1.3% |
| Immigrants | Belgium | 31.4 /100 | #196 | Fair 1.3% |
| Immigrants | Somalia | 31.3 /100 | #197 | Fair 1.3% |
| Immigrants | Norway | 31.1 /100 | #198 | Fair 1.3% |
| Jamaicans | 30.7 /100 | #199 | Fair 1.3% |
| Immigrants | Lithuania | 27.2 /100 | #200 | Fair 1.3% |
| Immigrants | Italy | 25.4 /100 | #201 | Fair 1.3% |
| Arapaho | 24.1 /100 | #202 | Fair 1.3% |
| Liberians | 24.0 /100 | #203 | Fair 1.3% |
Demographics Similar to Bhutanese by Disability Age Under 5
In terms of disability age under 5, the demographic groups most similar to Bhutanese are Immigrants from Eritrea (1.2%, a difference of 0.070%), Immigrants from Venezuela (1.2%, a difference of 0.34%), Immigrants from Senegal (1.2%, a difference of 0.35%), Immigrants from Philippines (1.2%, a difference of 0.37%), and Immigrants from Northern Africa (1.2%, a difference of 0.50%).
| Demographics | Rating | Rank | Disability Age Under 5 |
| Immigrants | Australia | 94.4 /100 | #112 | Exceptional 1.2% |
| Immigrants | Oceania | 94.2 /100 | #113 | Exceptional 1.2% |
| Belizeans | 93.9 /100 | #114 | Exceptional 1.2% |
| Immigrants | Caribbean | 93.8 /100 | #115 | Exceptional 1.2% |
| Immigrants | Northern Africa | 93.8 /100 | #116 | Exceptional 1.2% |
| Immigrants | Philippines | 93.5 /100 | #117 | Exceptional 1.2% |
| Immigrants | Venezuela | 93.4 /100 | #118 | Exceptional 1.2% |
| Bhutanese | 92.5 /100 | #119 | Exceptional 1.2% |
| Immigrants | Eritrea | 92.3 /100 | #120 | Exceptional 1.2% |
| Immigrants | Senegal | 91.4 /100 | #121 | Exceptional 1.2% |
| Aleuts | 90.7 /100 | #122 | Exceptional 1.2% |
| Zimbabweans | 90.6 /100 | #123 | Exceptional 1.2% |
| Immigrants | Cambodia | 90.5 /100 | #124 | Exceptional 1.2% |
| Japanese | 90.3 /100 | #125 | Exceptional 1.2% |
| Central Americans | 89.7 /100 | #126 | Excellent 1.2% |