Immigrants from Kazakhstan vs Lithuanian Female Disability
COMPARE
Immigrants from Kazakhstan
Lithuanian
Female Disability
Female Disability Comparison
Immigrants from Kazakhstan
Lithuanians
11.8%
FEMALE DISABILITY
97.0/ 100
METRIC RATING
120th/ 347
METRIC RANK
12.2%
FEMALE DISABILITY
59.5/ 100
METRIC RATING
166th/ 347
METRIC RANK
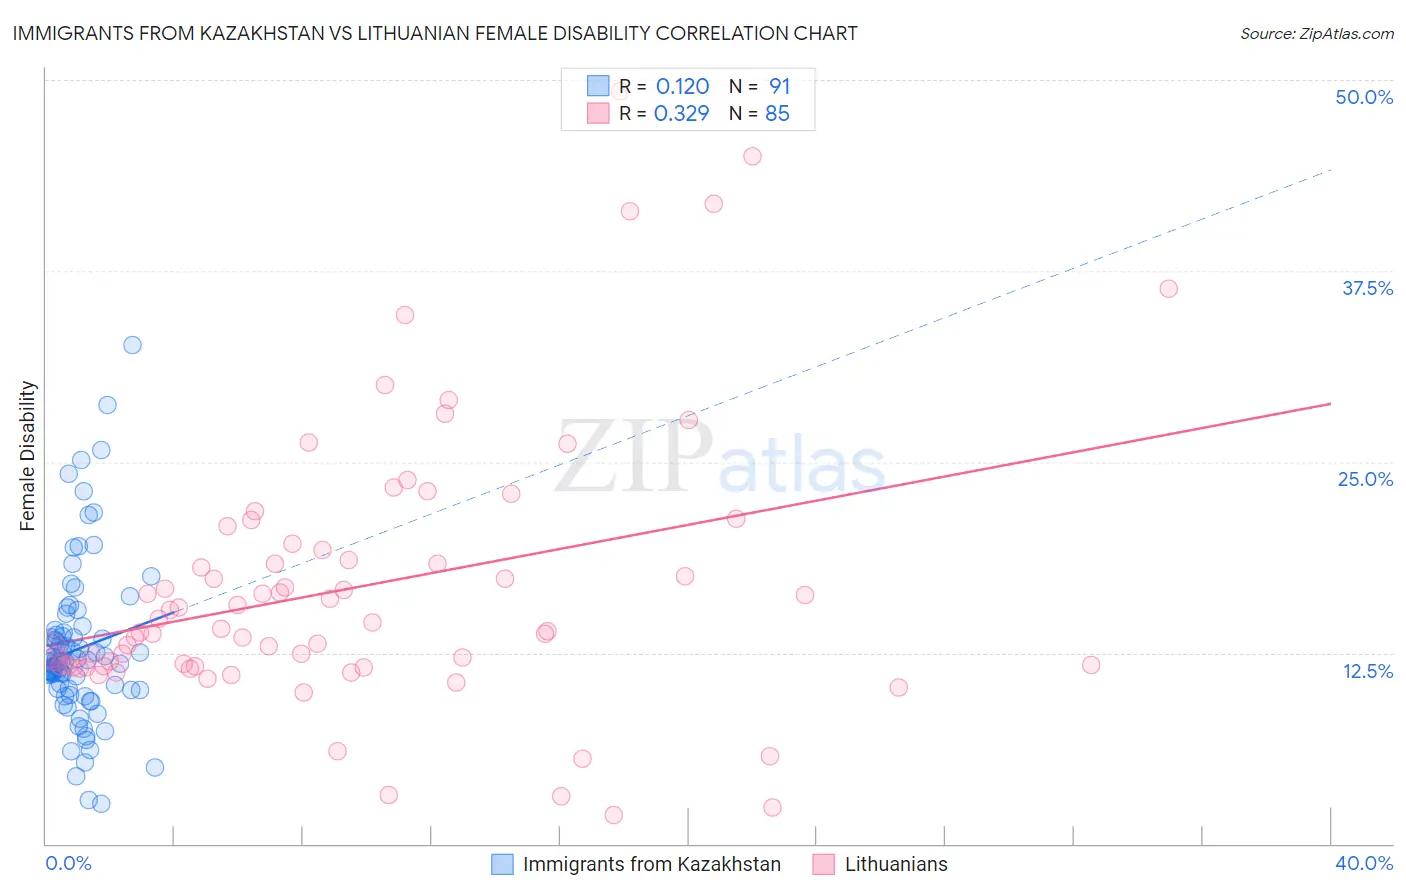
Immigrants from Kazakhstan vs Lithuanian Female Disability Correlation Chart
The statistical analysis conducted on geographies consisting of 124,443,706 people shows a poor positive correlation between the proportion of Immigrants from Kazakhstan and percentage of females with a disability in the United States with a correlation coefficient (R) of 0.120 and weighted average of 11.8%. Similarly, the statistical analysis conducted on geographies consisting of 421,926,295 people shows a mild positive correlation between the proportion of Lithuanians and percentage of females with a disability in the United States with a correlation coefficient (R) of 0.329 and weighted average of 12.2%, a difference of 3.0%.
Female Disability Correlation Summary
| Measurement | Immigrants from Kazakhstan | Lithuanian |
| Minimum | 2.6% | 1.9% |
| Maximum | 32.7% | 49.2% |
| Range | 30.1% | 47.3% |
| Mean | 12.7% | 16.8% |
| Median | 11.9% | 14.0% |
| Interquartile 25% (IQ1) | 10.1% | 11.6% |
| Interquartile 75% (IQ3) | 13.8% | 19.4% |
| Interquartile Range (IQR) | 3.8% | 7.8% |
| Standard Deviation (Sample) | 5.2% | 9.0% |
| Standard Deviation (Population) | 5.2% | 9.0% |
Similar Demographics by Female Disability
Demographics Similar to Immigrants from Kazakhstan by Female Disability
In terms of female disability, the demographic groups most similar to Immigrants from Kazakhstan are Immigrants from Netherlands (11.8%, a difference of 0.030%), Immigrants from North Macedonia (11.8%, a difference of 0.040%), Immigrants from Uganda (11.8%, a difference of 0.080%), Immigrants from Eastern Europe (11.8%, a difference of 0.090%), and Immigrants from Nigeria (11.8%, a difference of 0.090%).
| Demographics | Rating | Rank | Female Disability |
| Immigrants | Belarus | 97.8 /100 | #113 | Exceptional 11.8% |
| South Africans | 97.7 /100 | #114 | Exceptional 11.8% |
| Brazilians | 97.7 /100 | #115 | Exceptional 11.8% |
| Immigrants | Morocco | 97.6 /100 | #116 | Exceptional 11.8% |
| Immigrants | Eastern Europe | 97.2 /100 | #117 | Exceptional 11.8% |
| Immigrants | Nigeria | 97.2 /100 | #118 | Exceptional 11.8% |
| Immigrants | Uganda | 97.2 /100 | #119 | Exceptional 11.8% |
| Immigrants | Kazakhstan | 97.0 /100 | #120 | Exceptional 11.8% |
| Immigrants | Netherlands | 96.9 /100 | #121 | Exceptional 11.8% |
| Immigrants | North Macedonia | 96.8 /100 | #122 | Exceptional 11.8% |
| Immigrants | Croatia | 96.7 /100 | #123 | Exceptional 11.8% |
| Russians | 96.5 /100 | #124 | Exceptional 11.8% |
| Immigrants | Italy | 96.4 /100 | #125 | Exceptional 11.8% |
| Immigrants | Europe | 96.2 /100 | #126 | Exceptional 11.8% |
| South American Indians | 95.8 /100 | #127 | Exceptional 11.8% |
Demographics Similar to Lithuanians by Female Disability
In terms of female disability, the demographic groups most similar to Lithuanians are Immigrants from Latin America (12.2%, a difference of 0.020%), Immigrants from Haiti (12.2%, a difference of 0.030%), Lebanese (12.2%, a difference of 0.050%), Immigrants from Oceania (12.1%, a difference of 0.090%), and Maltese (12.2%, a difference of 0.10%).
| Demographics | Rating | Rank | Female Disability |
| Immigrants | Central America | 67.7 /100 | #159 | Good 12.1% |
| Immigrants | Guatemala | 66.0 /100 | #160 | Good 12.1% |
| Guyanese | 64.7 /100 | #161 | Good 12.1% |
| Immigrants | Ukraine | 64.3 /100 | #162 | Good 12.1% |
| Guatemalans | 63.8 /100 | #163 | Good 12.1% |
| Czechs | 63.6 /100 | #164 | Good 12.1% |
| Immigrants | Oceania | 61.8 /100 | #165 | Good 12.1% |
| Lithuanians | 59.5 /100 | #166 | Average 12.2% |
| Immigrants | Latin America | 59.0 /100 | #167 | Average 12.2% |
| Immigrants | Haiti | 58.8 /100 | #168 | Average 12.2% |
| Lebanese | 58.1 /100 | #169 | Average 12.2% |
| Maltese | 57.0 /100 | #170 | Average 12.2% |
| Immigrants | Southern Europe | 56.3 /100 | #171 | Average 12.2% |
| Haitians | 51.9 /100 | #172 | Average 12.2% |
| Immigrants | Mexico | 50.8 /100 | #173 | Average 12.2% |