Immigrants from Australia vs Lithuanian Female Disability
COMPARE
Immigrants from Australia
Lithuanian
Female Disability
Female Disability Comparison
Immigrants from Australia
Lithuanians
11.1%
FEMALE DISABILITY
100.0/ 100
METRIC RATING
32nd/ 347
METRIC RANK
12.2%
FEMALE DISABILITY
59.5/ 100
METRIC RATING
166th/ 347
METRIC RANK
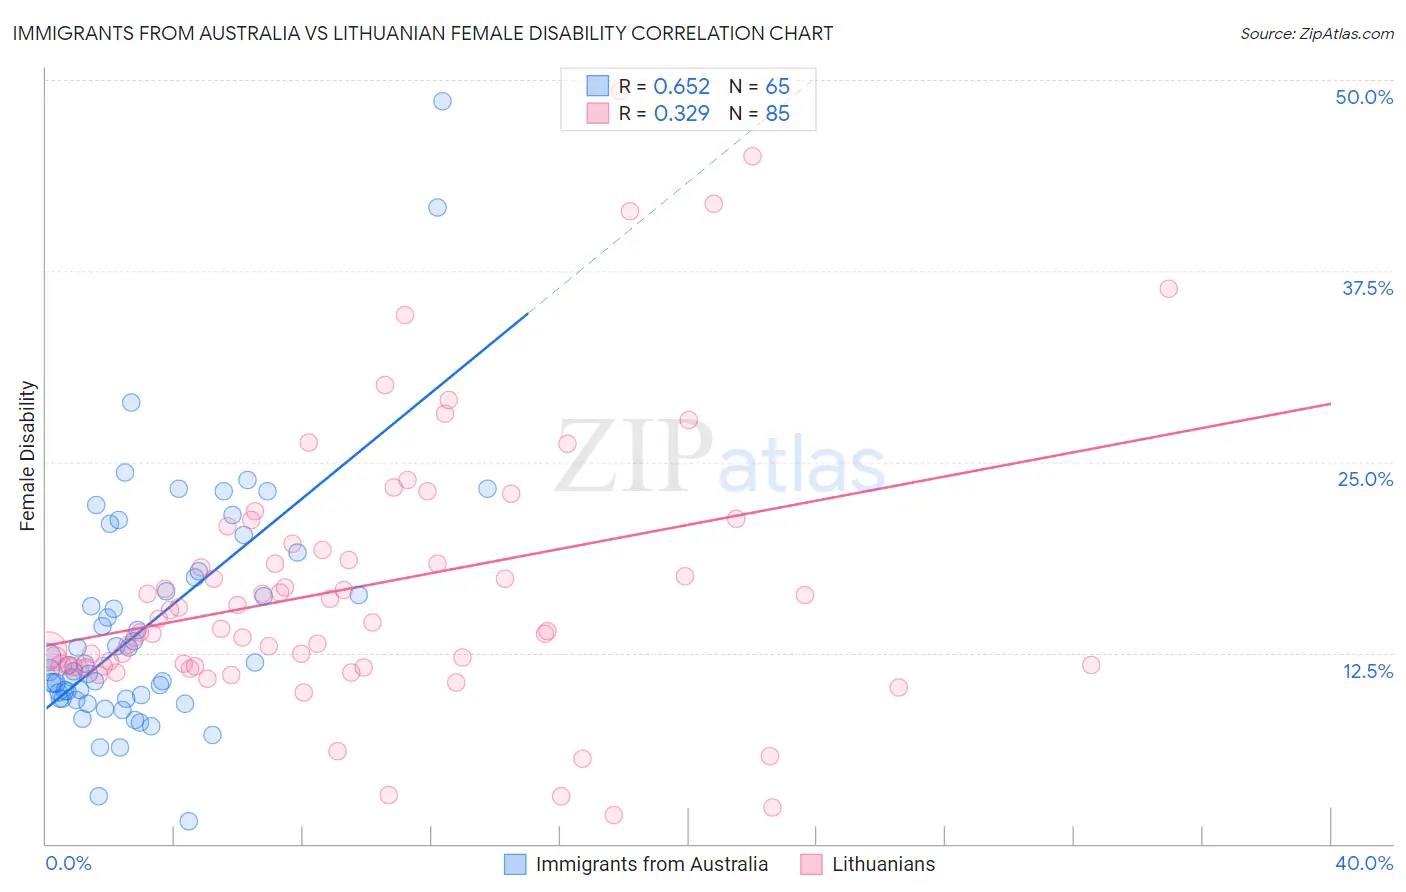
Immigrants from Australia vs Lithuanian Female Disability Correlation Chart
The statistical analysis conducted on geographies consisting of 227,197,779 people shows a significant positive correlation between the proportion of Immigrants from Australia and percentage of females with a disability in the United States with a correlation coefficient (R) of 0.652 and weighted average of 11.1%. Similarly, the statistical analysis conducted on geographies consisting of 421,926,295 people shows a mild positive correlation between the proportion of Lithuanians and percentage of females with a disability in the United States with a correlation coefficient (R) of 0.329 and weighted average of 12.2%, a difference of 9.2%.
Female Disability Correlation Summary
| Measurement | Immigrants from Australia | Lithuanian |
| Minimum | 1.4% | 1.9% |
| Maximum | 48.6% | 49.2% |
| Range | 47.1% | 47.3% |
| Mean | 14.3% | 16.8% |
| Median | 11.7% | 14.0% |
| Interquartile 25% (IQ1) | 9.5% | 11.6% |
| Interquartile 75% (IQ3) | 17.7% | 19.4% |
| Interquartile Range (IQR) | 8.1% | 7.8% |
| Standard Deviation (Sample) | 7.9% | 9.0% |
| Standard Deviation (Population) | 7.9% | 9.0% |
Similar Demographics by Female Disability
Demographics Similar to Immigrants from Australia by Female Disability
In terms of female disability, the demographic groups most similar to Immigrants from Australia are Immigrants from Egypt (11.1%, a difference of 0.080%), Immigrants from Kuwait (11.1%, a difference of 0.17%), Immigrants from Malaysia (11.1%, a difference of 0.27%), Turkish (11.1%, a difference of 0.27%), and Egyptian (11.1%, a difference of 0.33%).
| Demographics | Rating | Rank | Female Disability |
| Immigrants | Asia | 100.0 /100 | #25 | Exceptional 11.0% |
| Argentineans | 100.0 /100 | #26 | Exceptional 11.0% |
| Immigrants | Turkey | 100.0 /100 | #27 | Exceptional 11.1% |
| Egyptians | 100.0 /100 | #28 | Exceptional 11.1% |
| Immigrants | Malaysia | 100.0 /100 | #29 | Exceptional 11.1% |
| Turks | 100.0 /100 | #30 | Exceptional 11.1% |
| Immigrants | Kuwait | 100.0 /100 | #31 | Exceptional 11.1% |
| Immigrants | Australia | 100.0 /100 | #32 | Exceptional 11.1% |
| Immigrants | Egypt | 100.0 /100 | #33 | Exceptional 11.1% |
| Immigrants | Indonesia | 100.0 /100 | #34 | Exceptional 11.2% |
| Immigrants | Japan | 100.0 /100 | #35 | Exceptional 11.2% |
| Cypriots | 100.0 /100 | #36 | Exceptional 11.2% |
| Ethiopians | 100.0 /100 | #37 | Exceptional 11.2% |
| Immigrants | Ethiopia | 100.0 /100 | #38 | Exceptional 11.2% |
| Immigrants | Lithuania | 100.0 /100 | #39 | Exceptional 11.2% |
Demographics Similar to Lithuanians by Female Disability
In terms of female disability, the demographic groups most similar to Lithuanians are Immigrants from Latin America (12.2%, a difference of 0.020%), Immigrants from Haiti (12.2%, a difference of 0.030%), Lebanese (12.2%, a difference of 0.050%), Immigrants from Oceania (12.1%, a difference of 0.090%), and Maltese (12.2%, a difference of 0.10%).
| Demographics | Rating | Rank | Female Disability |
| Immigrants | Central America | 67.7 /100 | #159 | Good 12.1% |
| Immigrants | Guatemala | 66.0 /100 | #160 | Good 12.1% |
| Guyanese | 64.7 /100 | #161 | Good 12.1% |
| Immigrants | Ukraine | 64.3 /100 | #162 | Good 12.1% |
| Guatemalans | 63.8 /100 | #163 | Good 12.1% |
| Czechs | 63.6 /100 | #164 | Good 12.1% |
| Immigrants | Oceania | 61.8 /100 | #165 | Good 12.1% |
| Lithuanians | 59.5 /100 | #166 | Average 12.2% |
| Immigrants | Latin America | 59.0 /100 | #167 | Average 12.2% |
| Immigrants | Haiti | 58.8 /100 | #168 | Average 12.2% |
| Lebanese | 58.1 /100 | #169 | Average 12.2% |
| Maltese | 57.0 /100 | #170 | Average 12.2% |
| Immigrants | Southern Europe | 56.3 /100 | #171 | Average 12.2% |
| Haitians | 51.9 /100 | #172 | Average 12.2% |
| Immigrants | Mexico | 50.8 /100 | #173 | Average 12.2% |