Immigrants from Jordan vs Ecuadorian 11th Grade
COMPARE
Immigrants from Jordan
Ecuadorian
11th Grade
11th Grade Comparison
Immigrants from Jordan
Ecuadorians
93.1%
11TH GRADE
92.4/ 100
METRIC RATING
128th/ 347
METRIC RANK
89.6%
11TH GRADE
0.0/ 100
METRIC RATING
306th/ 347
METRIC RANK
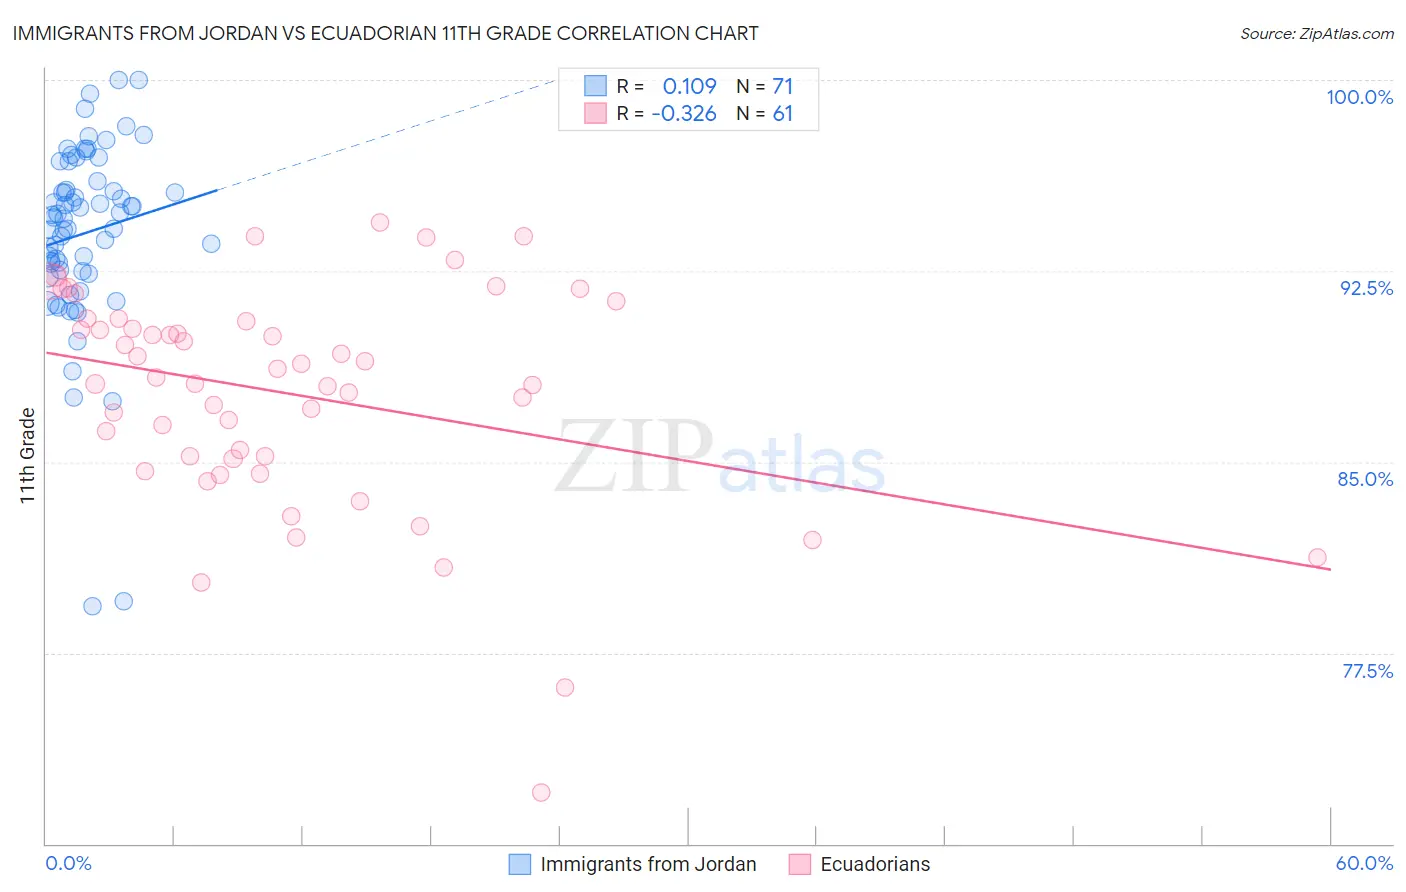
Immigrants from Jordan vs Ecuadorian 11th Grade Correlation Chart
The statistical analysis conducted on geographies consisting of 181,278,272 people shows a poor positive correlation between the proportion of Immigrants from Jordan and percentage of population with at least 11th grade education in the United States with a correlation coefficient (R) of 0.109 and weighted average of 93.1%. Similarly, the statistical analysis conducted on geographies consisting of 317,753,005 people shows a mild negative correlation between the proportion of Ecuadorians and percentage of population with at least 11th grade education in the United States with a correlation coefficient (R) of -0.326 and weighted average of 89.6%, a difference of 3.9%.
11th Grade Correlation Summary
| Measurement | Immigrants from Jordan | Ecuadorian |
| Minimum | 79.3% | 72.0% |
| Maximum | 100.0% | 94.4% |
| Range | 20.7% | 22.4% |
| Mean | 94.0% | 87.7% |
| Median | 94.6% | 88.3% |
| Interquartile 25% (IQ1) | 92.5% | 85.2% |
| Interquartile 75% (IQ3) | 96.0% | 90.6% |
| Interquartile Range (IQR) | 3.5% | 5.4% |
| Standard Deviation (Sample) | 3.7% | 4.3% |
| Standard Deviation (Population) | 3.7% | 4.3% |
Similar Demographics by 11th Grade
Demographics Similar to Immigrants from Jordan by 11th Grade
In terms of 11th grade, the demographic groups most similar to Immigrants from Jordan are Immigrants from Kazakhstan (93.1%, a difference of 0.0%), Immigrants from Ukraine (93.0%, a difference of 0.080%), Albanian (93.0%, a difference of 0.090%), Egyptian (93.0%, a difference of 0.090%), and Immigrants from Bosnia and Herzegovina (93.0%, a difference of 0.10%).
| Demographics | Rating | Rank | 11th Grade |
| German Russians | 96.4 /100 | #121 | Exceptional 93.3% |
| Immigrants | Belarus | 96.3 /100 | #122 | Exceptional 93.3% |
| Immigrants | Greece | 95.9 /100 | #123 | Exceptional 93.2% |
| Immigrants | Eastern Europe | 95.9 /100 | #124 | Exceptional 93.2% |
| Immigrants | Sri Lanka | 95.6 /100 | #125 | Exceptional 93.2% |
| Basques | 95.2 /100 | #126 | Exceptional 93.2% |
| Immigrants | Kazakhstan | 92.4 /100 | #127 | Exceptional 93.1% |
| Immigrants | Jordan | 92.4 /100 | #128 | Exceptional 93.1% |
| Immigrants | Ukraine | 89.8 /100 | #129 | Excellent 93.0% |
| Albanians | 89.5 /100 | #130 | Excellent 93.0% |
| Egyptians | 89.5 /100 | #131 | Excellent 93.0% |
| Immigrants | Bosnia and Herzegovina | 89.0 /100 | #132 | Excellent 93.0% |
| Mongolians | 87.6 /100 | #133 | Excellent 93.0% |
| Delaware | 87.3 /100 | #134 | Excellent 93.0% |
| Immigrants | Italy | 86.6 /100 | #135 | Excellent 92.9% |
Demographics Similar to Ecuadorians by 11th Grade
In terms of 11th grade, the demographic groups most similar to Ecuadorians are Immigrants from Cambodia (89.6%, a difference of 0.050%), Immigrants from Dominica (89.5%, a difference of 0.050%), Nepalese (89.5%, a difference of 0.070%), Immigrants from Bangladesh (89.5%, a difference of 0.10%), and Yaqui (89.5%, a difference of 0.11%).
| Demographics | Rating | Rank | 11th Grade |
| Japanese | 0.0 /100 | #299 | Tragic 89.9% |
| Immigrants | Haiti | 0.0 /100 | #300 | Tragic 89.9% |
| Guyanese | 0.0 /100 | #301 | Tragic 89.9% |
| Immigrants | Guyana | 0.0 /100 | #302 | Tragic 89.7% |
| Immigrants | Immigrants | 0.0 /100 | #303 | Tragic 89.7% |
| Yuman | 0.0 /100 | #304 | Tragic 89.7% |
| Immigrants | Cambodia | 0.0 /100 | #305 | Tragic 89.6% |
| Ecuadorians | 0.0 /100 | #306 | Tragic 89.6% |
| Immigrants | Dominica | 0.0 /100 | #307 | Tragic 89.5% |
| Nepalese | 0.0 /100 | #308 | Tragic 89.5% |
| Immigrants | Bangladesh | 0.0 /100 | #309 | Tragic 89.5% |
| Yaqui | 0.0 /100 | #310 | Tragic 89.5% |
| Vietnamese | 0.0 /100 | #311 | Tragic 89.4% |
| Immigrants | Portugal | 0.0 /100 | #312 | Tragic 89.3% |
| Immigrants | Caribbean | 0.0 /100 | #313 | Tragic 89.1% |