Immigrants from Japan vs Luxembourger Householder Income Ages 45 - 64 years
COMPARE
Immigrants from Japan
Luxembourger
Householder Income Ages 45 - 64 years
Householder Income Ages 45 - 64 years Comparison
Immigrants from Japan
Luxembourgers
$118,498
HOUSEHOLDER INCOME AGES 45 - 64 YEARS
100.0/ 100
METRIC RATING
24th/ 347
METRIC RANK
$103,536
HOUSEHOLDER INCOME AGES 45 - 64 YEARS
83.3/ 100
METRIC RATING
142nd/ 347
METRIC RANK
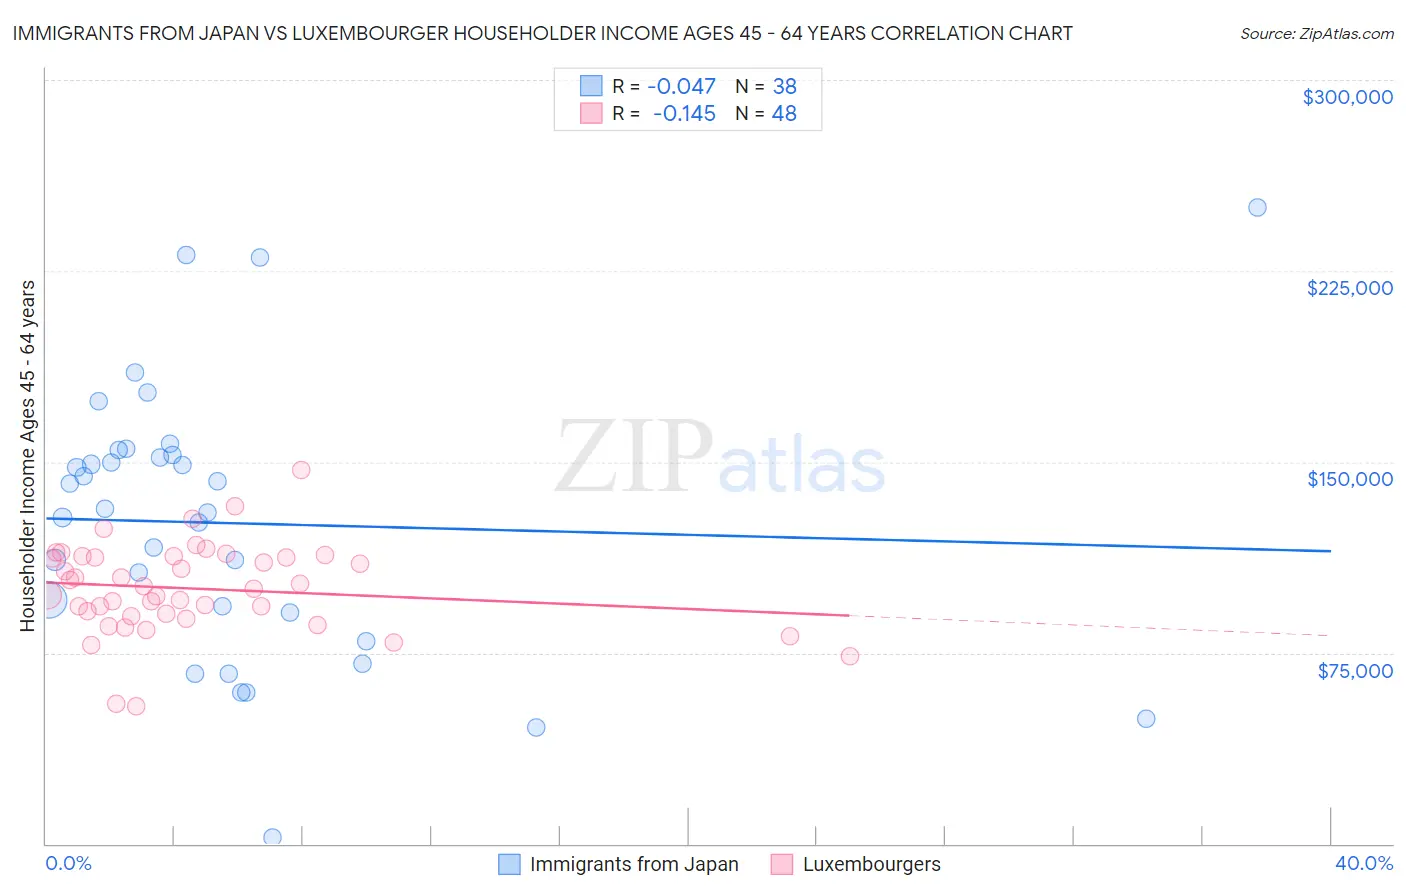
Immigrants from Japan vs Luxembourger Householder Income Ages 45 - 64 years Correlation Chart
The statistical analysis conducted on geographies consisting of 339,668,461 people shows no correlation between the proportion of Immigrants from Japan and household income with householder between the ages 45 and 64 in the United States with a correlation coefficient (R) of -0.047 and weighted average of $118,498. Similarly, the statistical analysis conducted on geographies consisting of 144,593,524 people shows a poor negative correlation between the proportion of Luxembourgers and household income with householder between the ages 45 and 64 in the United States with a correlation coefficient (R) of -0.145 and weighted average of $103,536, a difference of 14.4%.
Householder Income Ages 45 - 64 years Correlation Summary
| Measurement | Immigrants from Japan | Luxembourger |
| Minimum | $2,499 | $54,000 |
| Maximum | $250,001 | $147,008 |
| Range | $247,502 | $93,008 |
| Mean | $125,900 | $100,224 |
| Median | $130,922 | $100,694 |
| Interquartile 25% (IQ1) | $90,857 | $89,750 |
| Interquartile 75% (IQ3) | $152,701 | $112,857 |
| Interquartile Range (IQR) | $61,844 | $23,108 |
| Standard Deviation (Sample) | $53,396 | $17,750 |
| Standard Deviation (Population) | $52,689 | $17,564 |
Similar Demographics by Householder Income Ages 45 - 64 years
Demographics Similar to Immigrants from Japan by Householder Income Ages 45 - 64 years
In terms of householder income ages 45 - 64 years, the demographic groups most similar to Immigrants from Japan are Asian ($118,426, a difference of 0.060%), Immigrants from Sweden ($118,318, a difference of 0.15%), Bolivian ($118,871, a difference of 0.32%), Immigrants from Belgium ($118,932, a difference of 0.37%), and Immigrants from Northern Europe ($117,930, a difference of 0.48%).
| Demographics | Rating | Rank | Householder Income Ages 45 - 64 years |
| Burmese | 100.0 /100 | #17 | Exceptional $121,444 |
| Immigrants | Korea | 100.0 /100 | #18 | Exceptional $121,243 |
| Eastern Europeans | 100.0 /100 | #19 | Exceptional $120,684 |
| Immigrants | Australia | 100.0 /100 | #20 | Exceptional $119,308 |
| Immigrants | Sri Lanka | 100.0 /100 | #21 | Exceptional $119,094 |
| Immigrants | Belgium | 100.0 /100 | #22 | Exceptional $118,932 |
| Bolivians | 100.0 /100 | #23 | Exceptional $118,871 |
| Immigrants | Japan | 100.0 /100 | #24 | Exceptional $118,498 |
| Asians | 100.0 /100 | #25 | Exceptional $118,426 |
| Immigrants | Sweden | 100.0 /100 | #26 | Exceptional $118,318 |
| Immigrants | Northern Europe | 100.0 /100 | #27 | Exceptional $117,930 |
| Turks | 100.0 /100 | #28 | Exceptional $117,814 |
| Bhutanese | 100.0 /100 | #29 | Exceptional $117,750 |
| Immigrants | Bolivia | 100.0 /100 | #30 | Exceptional $117,731 |
| Immigrants | Asia | 100.0 /100 | #31 | Exceptional $116,566 |
Demographics Similar to Luxembourgers by Householder Income Ages 45 - 64 years
In terms of householder income ages 45 - 64 years, the demographic groups most similar to Luxembourgers are Serbian ($103,522, a difference of 0.010%), Czech ($103,507, a difference of 0.030%), Immigrants from Uganda ($103,584, a difference of 0.050%), Ugandan ($103,472, a difference of 0.060%), and Immigrants from Chile ($103,412, a difference of 0.12%).
| Demographics | Rating | Rank | Householder Income Ages 45 - 64 years |
| Brazilians | 88.6 /100 | #135 | Excellent $104,408 |
| Taiwanese | 87.4 /100 | #136 | Excellent $104,180 |
| Hungarians | 85.8 /100 | #137 | Excellent $103,913 |
| Ethiopians | 84.7 /100 | #138 | Excellent $103,736 |
| Immigrants | Oceania | 84.5 /100 | #139 | Excellent $103,705 |
| Norwegians | 84.3 /100 | #140 | Excellent $103,682 |
| Immigrants | Uganda | 83.7 /100 | #141 | Excellent $103,584 |
| Luxembourgers | 83.3 /100 | #142 | Excellent $103,536 |
| Serbians | 83.2 /100 | #143 | Excellent $103,522 |
| Czechs | 83.1 /100 | #144 | Excellent $103,507 |
| Ugandans | 82.9 /100 | #145 | Excellent $103,472 |
| Immigrants | Chile | 82.5 /100 | #146 | Excellent $103,412 |
| Basques | 82.3 /100 | #147 | Excellent $103,387 |
| Immigrants | Germany | 81.5 /100 | #148 | Excellent $103,282 |
| Immigrants | Sierra Leone | 81.1 /100 | #149 | Excellent $103,227 |