Cheyenne vs Immigrants from Italy Cognitive Disability
COMPARE
Cheyenne
Immigrants from Italy
Cognitive Disability
Cognitive Disability Comparison
Cheyenne
Immigrants from Italy
17.8%
COGNITIVE DISABILITY
1.7/ 100
METRIC RATING
238th/ 347
METRIC RANK
16.5%
COGNITIVE DISABILITY
99.8/ 100
METRIC RATING
47th/ 347
METRIC RANK
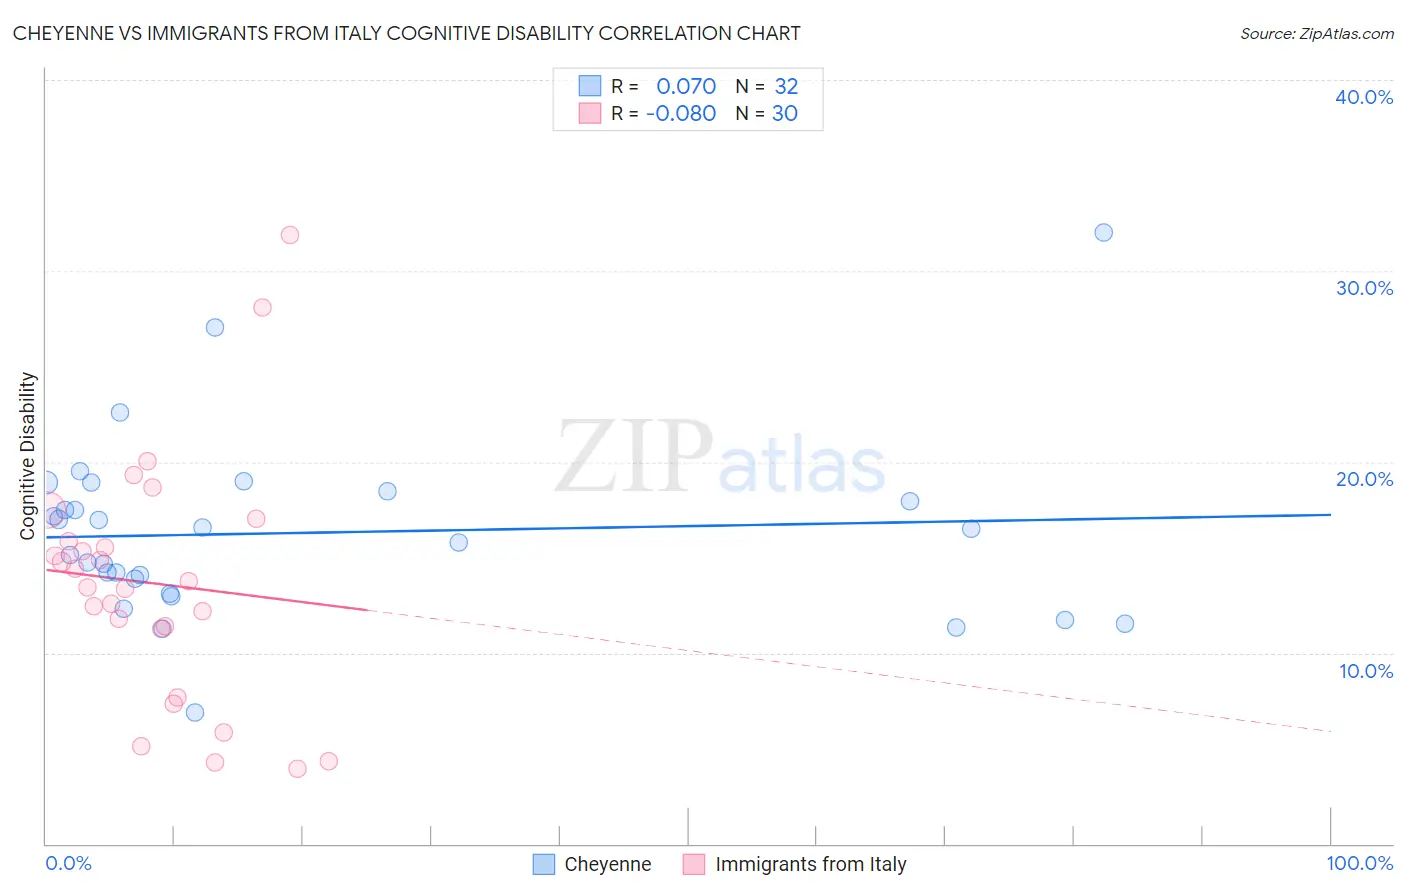
Cheyenne vs Immigrants from Italy Cognitive Disability Correlation Chart
The statistical analysis conducted on geographies consisting of 80,710,475 people shows a slight positive correlation between the proportion of Cheyenne and percentage of population with cognitive disability in the United States with a correlation coefficient (R) of 0.070 and weighted average of 17.8%. Similarly, the statistical analysis conducted on geographies consisting of 324,202,765 people shows a slight negative correlation between the proportion of Immigrants from Italy and percentage of population with cognitive disability in the United States with a correlation coefficient (R) of -0.080 and weighted average of 16.5%, a difference of 7.8%.
Cognitive Disability Correlation Summary
| Measurement | Cheyenne | Immigrants from Italy |
| Minimum | 6.9% | 3.9% |
| Maximum | 32.0% | 31.9% |
| Range | 25.1% | 27.9% |
| Mean | 16.3% | 13.6% |
| Median | 16.2% | 13.6% |
| Interquartile 25% (IQ1) | 13.5% | 11.3% |
| Interquartile 75% (IQ3) | 18.2% | 15.9% |
| Interquartile Range (IQR) | 4.7% | 4.6% |
| Standard Deviation (Sample) | 4.7% | 6.4% |
| Standard Deviation (Population) | 4.6% | 6.3% |
Similar Demographics by Cognitive Disability
Demographics Similar to Cheyenne by Cognitive Disability
In terms of cognitive disability, the demographic groups most similar to Cheyenne are Immigrants from Iraq (17.8%, a difference of 0.040%), Immigrants from Mexico (17.8%, a difference of 0.040%), Osage (17.8%, a difference of 0.10%), Spanish American Indian (17.8%, a difference of 0.10%), and Panamanian (17.8%, a difference of 0.12%).
| Demographics | Rating | Rank | Cognitive Disability |
| Guatemalans | 2.1 /100 | #231 | Tragic 17.8% |
| Tongans | 2.1 /100 | #232 | Tragic 17.8% |
| Panamanians | 2.1 /100 | #233 | Tragic 17.8% |
| Osage | 2.0 /100 | #234 | Tragic 17.8% |
| Spanish American Indians | 2.0 /100 | #235 | Tragic 17.8% |
| Immigrants | Iraq | 1.8 /100 | #236 | Tragic 17.8% |
| Immigrants | Mexico | 1.8 /100 | #237 | Tragic 17.8% |
| Cheyenne | 1.7 /100 | #238 | Tragic 17.8% |
| Cajuns | 1.4 /100 | #239 | Tragic 17.8% |
| Iraqis | 1.4 /100 | #240 | Tragic 17.8% |
| Mexicans | 1.1 /100 | #241 | Tragic 17.8% |
| Paiute | 1.1 /100 | #242 | Tragic 17.8% |
| Immigrants | Bangladesh | 1.0 /100 | #243 | Tragic 17.8% |
| Jamaicans | 0.9 /100 | #244 | Tragic 17.9% |
| Trinidadians and Tobagonians | 0.8 /100 | #245 | Tragic 17.9% |
Demographics Similar to Immigrants from Italy by Cognitive Disability
In terms of cognitive disability, the demographic groups most similar to Immigrants from Italy are Immigrants from North America (16.5%, a difference of 0.0%), Immigrants from Colombia (16.5%, a difference of 0.030%), Immigrants from Europe (16.5%, a difference of 0.040%), Iranian (16.5%, a difference of 0.040%), and Macedonian (16.5%, a difference of 0.050%).
| Demographics | Rating | Rank | Cognitive Disability |
| Immigrants | Belarus | 99.9 /100 | #40 | Exceptional 16.5% |
| Cubans | 99.9 /100 | #41 | Exceptional 16.5% |
| Hungarians | 99.9 /100 | #42 | Exceptional 16.5% |
| Immigrants | Canada | 99.8 /100 | #43 | Exceptional 16.5% |
| Macedonians | 99.8 /100 | #44 | Exceptional 16.5% |
| Immigrants | Europe | 99.8 /100 | #45 | Exceptional 16.5% |
| Immigrants | Colombia | 99.8 /100 | #46 | Exceptional 16.5% |
| Immigrants | Italy | 99.8 /100 | #47 | Exceptional 16.5% |
| Immigrants | North America | 99.8 /100 | #48 | Exceptional 16.5% |
| Iranians | 99.8 /100 | #49 | Exceptional 16.5% |
| Norwegians | 99.8 /100 | #50 | Exceptional 16.5% |
| Immigrants | Korea | 99.8 /100 | #51 | Exceptional 16.5% |
| Soviet Union | 99.8 /100 | #52 | Exceptional 16.5% |
| Swedes | 99.8 /100 | #53 | Exceptional 16.5% |
| Immigrants | Iran | 99.8 /100 | #54 | Exceptional 16.5% |