Immigrants from Israel vs Immigrants from Greece Disability Age Over 75
COMPARE
Immigrants from Israel
Immigrants from Greece
Disability Age Over 75
Disability Age Over 75 Comparison
Immigrants from Israel
Immigrants from Greece
45.9%
DISABILITY AGE OVER 75
99.6/ 100
METRIC RATING
58th/ 347
METRIC RANK
45.2%
DISABILITY AGE OVER 75
100.0/ 100
METRIC RATING
19th/ 347
METRIC RANK
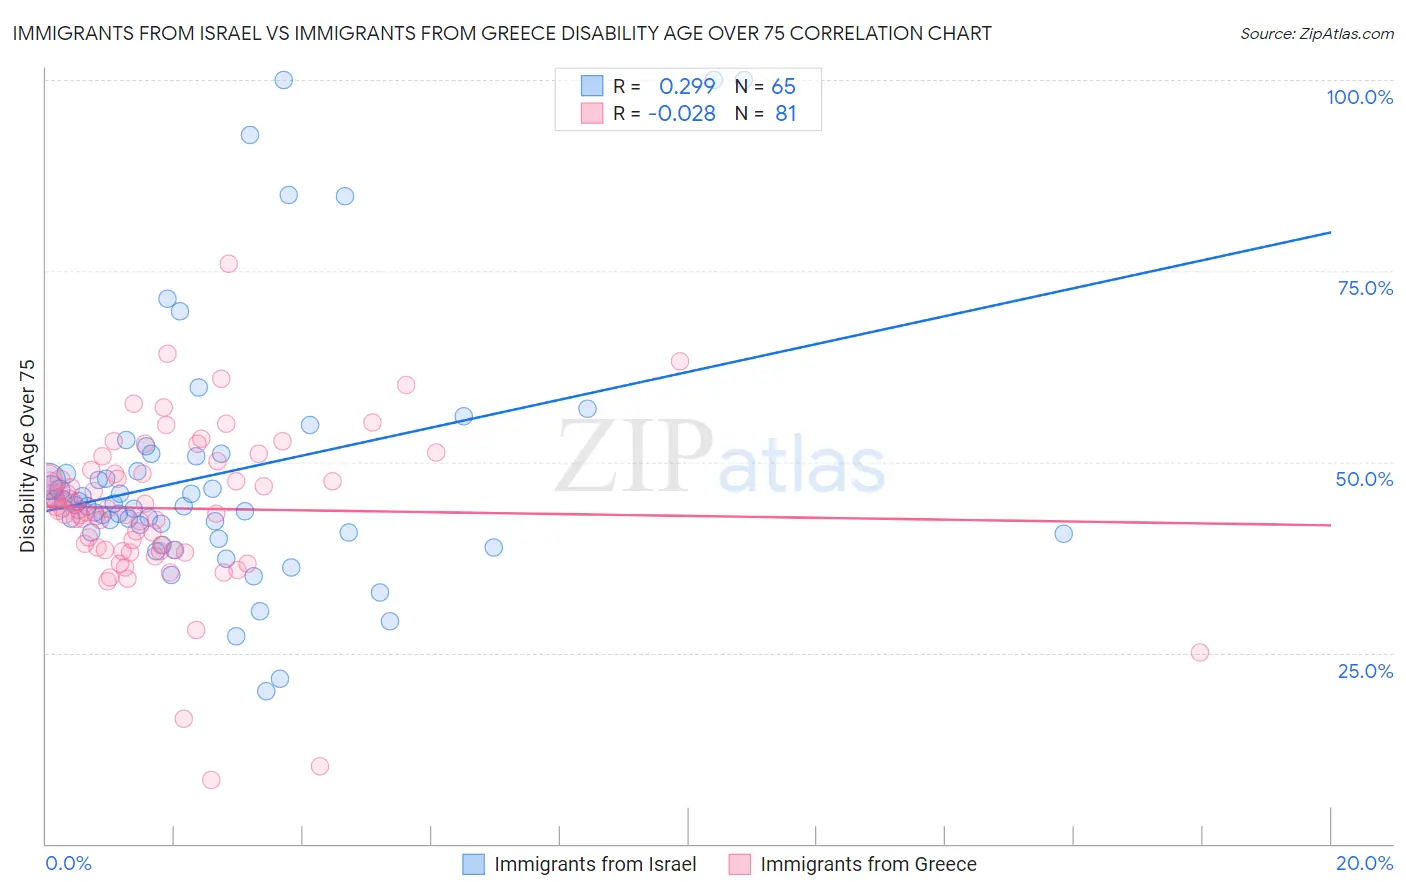
Immigrants from Israel vs Immigrants from Greece Disability Age Over 75 Correlation Chart
The statistical analysis conducted on geographies consisting of 209,886,024 people shows a weak positive correlation between the proportion of Immigrants from Israel and percentage of population with a disability over the age of 75 in the United States with a correlation coefficient (R) of 0.299 and weighted average of 45.9%. Similarly, the statistical analysis conducted on geographies consisting of 216,798,152 people shows no correlation between the proportion of Immigrants from Greece and percentage of population with a disability over the age of 75 in the United States with a correlation coefficient (R) of -0.028 and weighted average of 45.2%, a difference of 1.5%.
Disability Age Over 75 Correlation Summary
| Measurement | Immigrants from Israel | Immigrants from Greece |
| Minimum | 20.0% | 8.3% |
| Maximum | 100.0% | 75.9% |
| Range | 80.0% | 67.5% |
| Mean | 48.5% | 43.9% |
| Median | 44.4% | 43.8% |
| Interquartile 25% (IQ1) | 40.6% | 38.5% |
| Interquartile 75% (IQ3) | 50.9% | 48.6% |
| Interquartile Range (IQR) | 10.3% | 10.2% |
| Standard Deviation (Sample) | 17.1% | 10.4% |
| Standard Deviation (Population) | 16.9% | 10.3% |
Similar Demographics by Disability Age Over 75
Demographics Similar to Immigrants from Israel by Disability Age Over 75
In terms of disability age over 75, the demographic groups most similar to Immigrants from Israel are Immigrants from Turkey (45.9%, a difference of 0.0%), Iranian (45.9%, a difference of 0.010%), Immigrants from Europe (45.9%, a difference of 0.010%), Immigrants from Netherlands (45.9%, a difference of 0.020%), and Immigrants from Argentina (45.9%, a difference of 0.030%).
| Demographics | Rating | Rank | Disability Age Over 75 |
| Immigrants | Korea | 99.7 /100 | #51 | Exceptional 45.8% |
| Immigrants | France | 99.7 /100 | #52 | Exceptional 45.8% |
| Immigrants | Italy | 99.7 /100 | #53 | Exceptional 45.8% |
| Slovaks | 99.6 /100 | #54 | Exceptional 45.8% |
| Maltese | 99.6 /100 | #55 | Exceptional 45.8% |
| Immigrants | Netherlands | 99.6 /100 | #56 | Exceptional 45.9% |
| Immigrants | Turkey | 99.6 /100 | #57 | Exceptional 45.9% |
| Immigrants | Israel | 99.6 /100 | #58 | Exceptional 45.9% |
| Iranians | 99.6 /100 | #59 | Exceptional 45.9% |
| Immigrants | Europe | 99.6 /100 | #60 | Exceptional 45.9% |
| Immigrants | Argentina | 99.6 /100 | #61 | Exceptional 45.9% |
| Burmese | 99.5 /100 | #62 | Exceptional 45.9% |
| Immigrants | Norway | 99.5 /100 | #63 | Exceptional 45.9% |
| Immigrants | North Macedonia | 99.5 /100 | #64 | Exceptional 45.9% |
| Austrians | 99.5 /100 | #65 | Exceptional 46.0% |
Demographics Similar to Immigrants from Greece by Disability Age Over 75
In terms of disability age over 75, the demographic groups most similar to Immigrants from Greece are Bolivian (45.2%, a difference of 0.010%), Immigrants from India (45.2%, a difference of 0.030%), Immigrants from Northern Europe (45.2%, a difference of 0.040%), Immigrants from Serbia (45.3%, a difference of 0.11%), and Immigrants from Sweden (45.1%, a difference of 0.14%).
| Demographics | Rating | Rank | Disability Age Over 75 |
| Immigrants | Czechoslovakia | 100.0 /100 | #12 | Exceptional 45.1% |
| Latvians | 100.0 /100 | #13 | Exceptional 45.1% |
| Immigrants | Scotland | 100.0 /100 | #14 | Exceptional 45.1% |
| Immigrants | Sweden | 100.0 /100 | #15 | Exceptional 45.1% |
| Immigrants | Northern Europe | 100.0 /100 | #16 | Exceptional 45.2% |
| Immigrants | India | 100.0 /100 | #17 | Exceptional 45.2% |
| Bolivians | 100.0 /100 | #18 | Exceptional 45.2% |
| Immigrants | Greece | 100.0 /100 | #19 | Exceptional 45.2% |
| Immigrants | Serbia | 100.0 /100 | #20 | Exceptional 45.3% |
| Immigrants | Belgium | 100.0 /100 | #21 | Exceptional 45.3% |
| Immigrants | South Africa | 100.0 /100 | #22 | Exceptional 45.3% |
| Immigrants | Switzerland | 99.9 /100 | #23 | Exceptional 45.3% |
| Poles | 99.9 /100 | #24 | Exceptional 45.3% |
| Immigrants | Bolivia | 99.9 /100 | #25 | Exceptional 45.4% |
| Macedonians | 99.9 /100 | #26 | Exceptional 45.4% |