Immigrants from Iraq vs Vietnamese Female Unemployment
COMPARE
Immigrants from Iraq
Vietnamese
Female Unemployment
Female Unemployment Comparison
Immigrants from Iraq
Vietnamese
5.5%
FEMALE UNEMPLOYMENT
3.9/ 100
METRIC RATING
231st/ 347
METRIC RANK
6.5%
FEMALE UNEMPLOYMENT
0.0/ 100
METRIC RATING
322nd/ 347
METRIC RANK
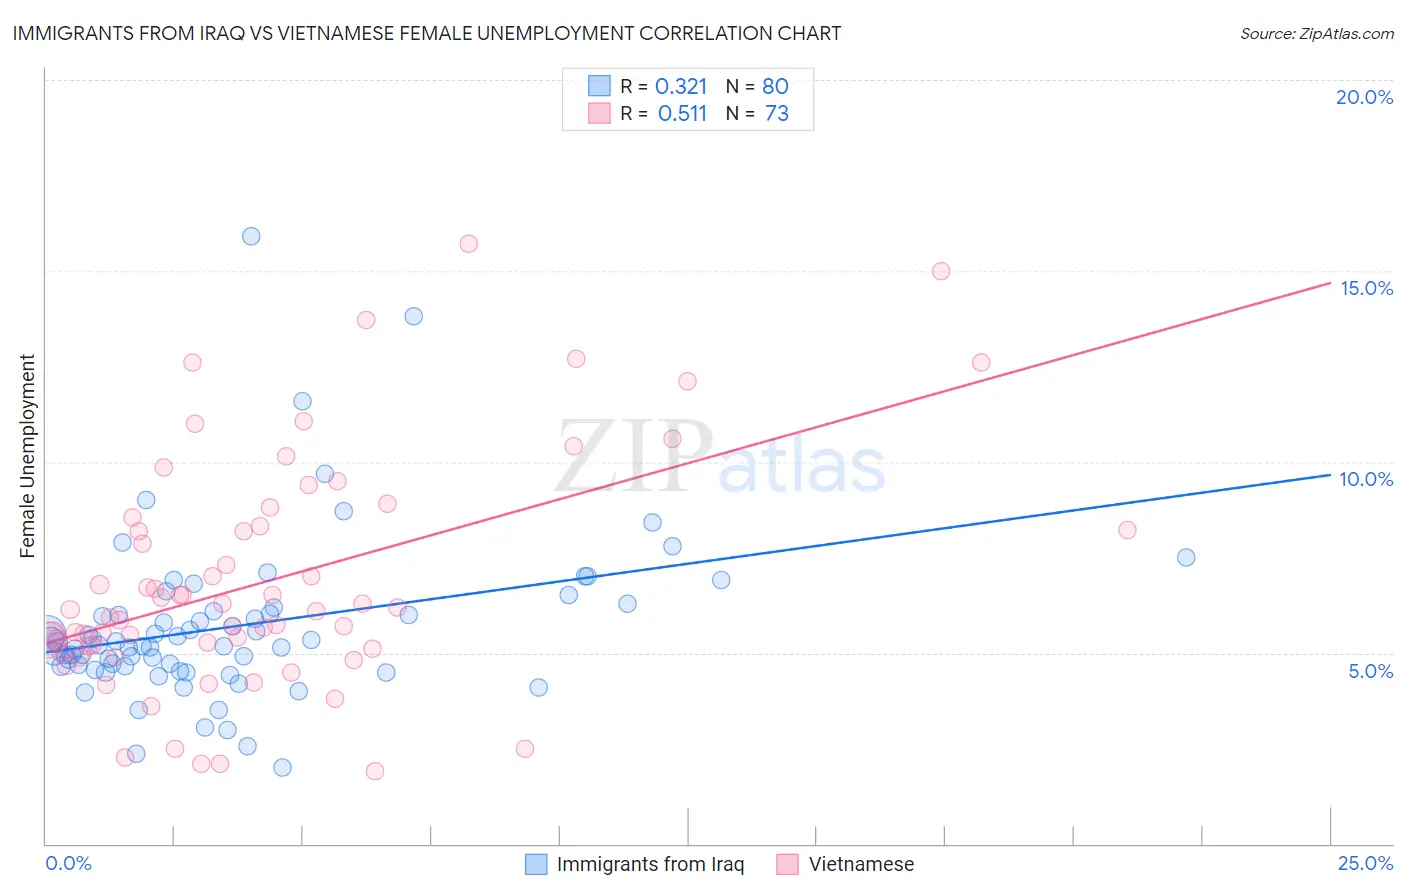
Immigrants from Iraq vs Vietnamese Female Unemployment Correlation Chart
The statistical analysis conducted on geographies consisting of 194,592,828 people shows a mild positive correlation between the proportion of Immigrants from Iraq and unemploymnet rate among females in the United States with a correlation coefficient (R) of 0.321 and weighted average of 5.5%. Similarly, the statistical analysis conducted on geographies consisting of 170,617,487 people shows a substantial positive correlation between the proportion of Vietnamese and unemploymnet rate among females in the United States with a correlation coefficient (R) of 0.511 and weighted average of 6.5%, a difference of 17.9%.
Female Unemployment Correlation Summary
| Measurement | Immigrants from Iraq | Vietnamese |
| Minimum | 2.0% | 1.9% |
| Maximum | 15.9% | 15.7% |
| Range | 13.9% | 13.8% |
| Mean | 5.7% | 6.9% |
| Median | 5.2% | 6.1% |
| Interquartile 25% (IQ1) | 4.7% | 5.1% |
| Interquartile 75% (IQ3) | 6.1% | 8.4% |
| Interquartile Range (IQR) | 1.5% | 3.3% |
| Standard Deviation (Sample) | 2.2% | 3.0% |
| Standard Deviation (Population) | 2.1% | 3.0% |
Similar Demographics by Female Unemployment
Demographics Similar to Immigrants from Iraq by Female Unemployment
In terms of female unemployment, the demographic groups most similar to Immigrants from Iraq are Liberian (5.5%, a difference of 0.010%), Moroccan (5.5%, a difference of 0.21%), Immigrants from Lebanon (5.5%, a difference of 0.24%), Immigrants from Iran (5.5%, a difference of 0.24%), and Immigrants from Uruguay (5.5%, a difference of 0.27%).
| Demographics | Rating | Rank | Female Unemployment |
| Iraqis | 7.1 /100 | #224 | Tragic 5.5% |
| French American Indians | 6.1 /100 | #225 | Tragic 5.5% |
| Immigrants | Peru | 5.9 /100 | #226 | Tragic 5.5% |
| Immigrants | Philippines | 5.3 /100 | #227 | Tragic 5.5% |
| Israelis | 4.8 /100 | #228 | Tragic 5.5% |
| Panamanians | 4.7 /100 | #229 | Tragic 5.5% |
| Immigrants | Uruguay | 4.7 /100 | #230 | Tragic 5.5% |
| Immigrants | Iraq | 3.9 /100 | #231 | Tragic 5.5% |
| Liberians | 3.9 /100 | #232 | Tragic 5.5% |
| Moroccans | 3.4 /100 | #233 | Tragic 5.5% |
| Immigrants | Lebanon | 3.3 /100 | #234 | Tragic 5.5% |
| Immigrants | Iran | 3.3 /100 | #235 | Tragic 5.5% |
| Immigrants | Cambodia | 3.3 /100 | #236 | Tragic 5.5% |
| Immigrants | Panama | 3.2 /100 | #237 | Tragic 5.5% |
| Sierra Leoneans | 3.2 /100 | #238 | Tragic 5.5% |
Demographics Similar to Vietnamese by Female Unemployment
In terms of female unemployment, the demographic groups most similar to Vietnamese are Black/African American (6.5%, a difference of 0.080%), Immigrants from Belize (6.5%, a difference of 0.10%), Immigrants from Dominica (6.5%, a difference of 0.62%), Immigrants from Bangladesh (6.5%, a difference of 0.63%), and British West Indian (6.4%, a difference of 0.82%).
| Demographics | Rating | Rank | Female Unemployment |
| Pueblo | 0.0 /100 | #315 | Tragic 6.4% |
| Houma | 0.0 /100 | #316 | Tragic 6.4% |
| Immigrants | St. Vincent and the Grenadines | 0.0 /100 | #317 | Tragic 6.4% |
| British West Indians | 0.0 /100 | #318 | Tragic 6.4% |
| Immigrants | Bangladesh | 0.0 /100 | #319 | Tragic 6.5% |
| Immigrants | Dominica | 0.0 /100 | #320 | Tragic 6.5% |
| Blacks/African Americans | 0.0 /100 | #321 | Tragic 6.5% |
| Vietnamese | 0.0 /100 | #322 | Tragic 6.5% |
| Immigrants | Belize | 0.0 /100 | #323 | Tragic 6.5% |
| Cheyenne | 0.0 /100 | #324 | Tragic 6.6% |
| Apache | 0.0 /100 | #325 | Tragic 6.6% |
| Natives/Alaskans | 0.0 /100 | #326 | Tragic 6.6% |
| Alaska Natives | 0.0 /100 | #327 | Tragic 6.6% |
| Guyanese | 0.0 /100 | #328 | Tragic 6.7% |
| Immigrants | Guyana | 0.0 /100 | #329 | Tragic 6.7% |