Immigrants from Iran vs Immigrants from Korea Disability Age Over 75
COMPARE
Immigrants from Iran
Immigrants from Korea
Disability Age Over 75
Disability Age Over 75 Comparison
Immigrants from Iran
Immigrants from Korea
47.1%
DISABILITY AGE OVER 75
74.7/ 100
METRIC RATING
155th/ 347
METRIC RANK
45.8%
DISABILITY AGE OVER 75
99.7/ 100
METRIC RATING
51st/ 347
METRIC RANK
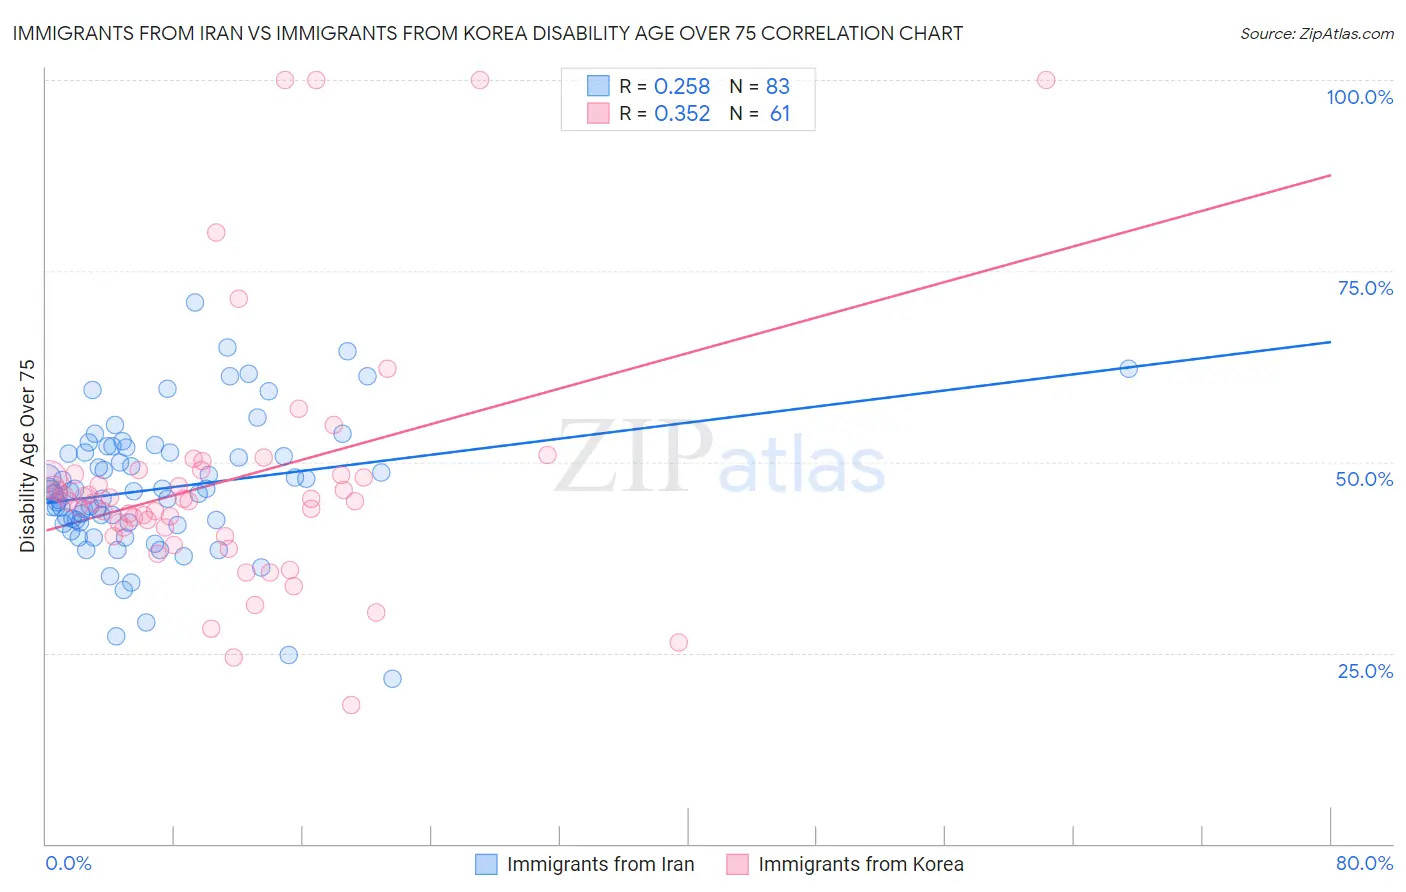
Immigrants from Iran vs Immigrants from Korea Disability Age Over 75 Correlation Chart
The statistical analysis conducted on geographies consisting of 279,744,511 people shows a weak positive correlation between the proportion of Immigrants from Iran and percentage of population with a disability over the age of 75 in the United States with a correlation coefficient (R) of 0.258 and weighted average of 47.1%. Similarly, the statistical analysis conducted on geographies consisting of 415,245,422 people shows a mild positive correlation between the proportion of Immigrants from Korea and percentage of population with a disability over the age of 75 in the United States with a correlation coefficient (R) of 0.352 and weighted average of 45.8%, a difference of 2.8%.
Disability Age Over 75 Correlation Summary
| Measurement | Immigrants from Iran | Immigrants from Korea |
| Minimum | 21.6% | 18.2% |
| Maximum | 70.8% | 100.0% |
| Range | 49.3% | 81.8% |
| Mean | 46.5% | 47.7% |
| Median | 46.1% | 44.9% |
| Interquartile 25% (IQ1) | 42.1% | 40.9% |
| Interquartile 75% (IQ3) | 51.2% | 48.6% |
| Interquartile Range (IQR) | 9.2% | 7.8% |
| Standard Deviation (Sample) | 8.8% | 16.9% |
| Standard Deviation (Population) | 8.8% | 16.7% |
Similar Demographics by Disability Age Over 75
Demographics Similar to Immigrants from Iran by Disability Age Over 75
In terms of disability age over 75, the demographic groups most similar to Immigrants from Iran are Immigrants from Belarus (47.1%, a difference of 0.0%), Immigrants from Zaire (47.1%, a difference of 0.010%), Arab (47.1%, a difference of 0.040%), Immigrants from Asia (47.0%, a difference of 0.060%), and Bhutanese (47.1%, a difference of 0.060%).
| Demographics | Rating | Rank | Disability Age Over 75 |
| Asians | 81.6 /100 | #148 | Excellent 46.9% |
| Welsh | 81.3 /100 | #149 | Excellent 47.0% |
| Immigrants | Russia | 79.3 /100 | #150 | Good 47.0% |
| French Canadians | 79.0 /100 | #151 | Good 47.0% |
| Immigrants | Asia | 76.5 /100 | #152 | Good 47.0% |
| Immigrants | Zaire | 74.8 /100 | #153 | Good 47.1% |
| Immigrants | Belarus | 74.8 /100 | #154 | Good 47.1% |
| Immigrants | Iran | 74.7 /100 | #155 | Good 47.1% |
| Arabs | 73.3 /100 | #156 | Good 47.1% |
| Bhutanese | 72.6 /100 | #157 | Good 47.1% |
| Immigrants | Guyana | 71.9 /100 | #158 | Good 47.1% |
| Immigrants | Morocco | 71.4 /100 | #159 | Good 47.1% |
| Immigrants | Middle Africa | 68.3 /100 | #160 | Good 47.1% |
| South American Indians | 68.1 /100 | #161 | Good 47.1% |
| Pennsylvania Germans | 66.0 /100 | #162 | Good 47.2% |
Demographics Similar to Immigrants from Korea by Disability Age Over 75
In terms of disability age over 75, the demographic groups most similar to Immigrants from Korea are Belgian (45.8%, a difference of 0.0%), Immigrants from France (45.8%, a difference of 0.050%), Immigrants from Italy (45.8%, a difference of 0.060%), Immigrants from North America (45.7%, a difference of 0.13%), and Slovak (45.8%, a difference of 0.14%).
| Demographics | Rating | Rank | Disability Age Over 75 |
| Australians | 99.8 /100 | #44 | Exceptional 45.7% |
| Turks | 99.8 /100 | #45 | Exceptional 45.7% |
| Swedes | 99.8 /100 | #46 | Exceptional 45.7% |
| Immigrants | Canada | 99.8 /100 | #47 | Exceptional 45.7% |
| Croatians | 99.8 /100 | #48 | Exceptional 45.7% |
| Immigrants | North America | 99.8 /100 | #49 | Exceptional 45.7% |
| Belgians | 99.7 /100 | #50 | Exceptional 45.8% |
| Immigrants | Korea | 99.7 /100 | #51 | Exceptional 45.8% |
| Immigrants | France | 99.7 /100 | #52 | Exceptional 45.8% |
| Immigrants | Italy | 99.7 /100 | #53 | Exceptional 45.8% |
| Slovaks | 99.6 /100 | #54 | Exceptional 45.8% |
| Maltese | 99.6 /100 | #55 | Exceptional 45.8% |
| Immigrants | Netherlands | 99.6 /100 | #56 | Exceptional 45.9% |
| Immigrants | Turkey | 99.6 /100 | #57 | Exceptional 45.9% |
| Immigrants | Israel | 99.6 /100 | #58 | Exceptional 45.9% |