Immigrants from Iran vs Cape Verdean Male Disability
COMPARE
Immigrants from Iran
Cape Verdean
Male Disability
Male Disability Comparison
Immigrants from Iran
Cape Verdeans
9.7%
MALE DISABILITY
100.0/ 100
METRIC RATING
14th/ 347
METRIC RANK
12.8%
MALE DISABILITY
0.0/ 100
METRIC RATING
287th/ 347
METRIC RANK
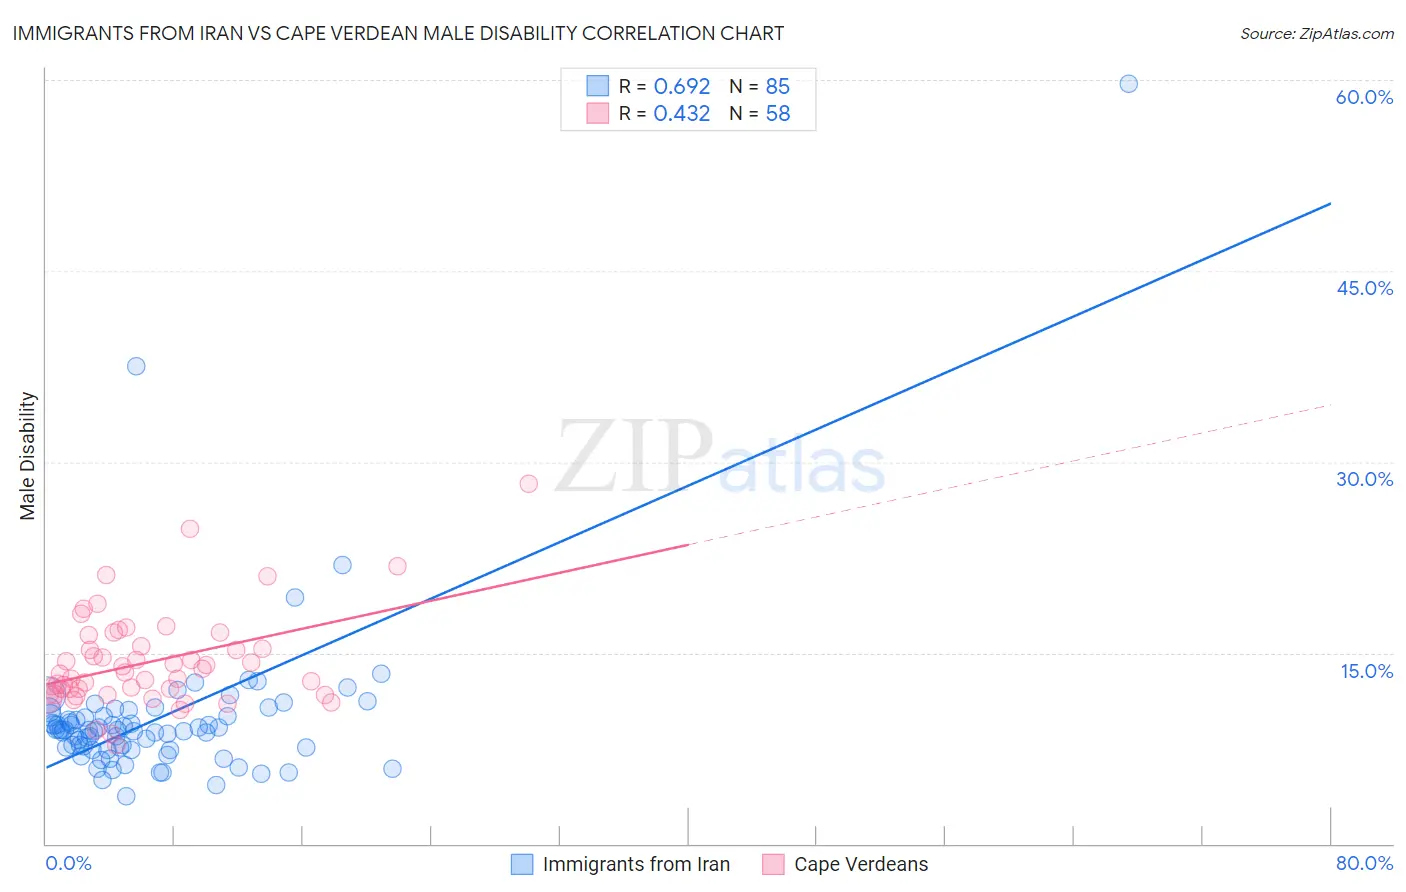
Immigrants from Iran vs Cape Verdean Male Disability Correlation Chart
The statistical analysis conducted on geographies consisting of 279,892,018 people shows a significant positive correlation between the proportion of Immigrants from Iran and percentage of males with a disability in the United States with a correlation coefficient (R) of 0.692 and weighted average of 9.7%. Similarly, the statistical analysis conducted on geographies consisting of 107,575,167 people shows a moderate positive correlation between the proportion of Cape Verdeans and percentage of males with a disability in the United States with a correlation coefficient (R) of 0.432 and weighted average of 12.8%, a difference of 32.0%.
Male Disability Correlation Summary
| Measurement | Immigrants from Iran | Cape Verdean |
| Minimum | 3.8% | 7.8% |
| Maximum | 59.7% | 28.3% |
| Range | 55.9% | 20.5% |
| Mean | 9.9% | 14.3% |
| Median | 8.9% | 13.4% |
| Interquartile 25% (IQ1) | 7.5% | 11.7% |
| Interquartile 75% (IQ3) | 10.1% | 15.6% |
| Interquartile Range (IQR) | 2.6% | 3.8% |
| Standard Deviation (Sample) | 6.8% | 3.7% |
| Standard Deviation (Population) | 6.8% | 3.7% |
Similar Demographics by Male Disability
Demographics Similar to Immigrants from Iran by Male Disability
In terms of male disability, the demographic groups most similar to Immigrants from Iran are Iranian (9.7%, a difference of 0.10%), Bolivian (9.6%, a difference of 0.33%), Indian (Asian) (9.7%, a difference of 0.45%), Immigrants from Eastern Asia (9.6%, a difference of 0.56%), and Okinawan (9.8%, a difference of 1.1%).
| Demographics | Rating | Rank | Male Disability |
| Immigrants | Bolivia | 100.0 /100 | #7 | Exceptional 9.5% |
| Immigrants | China | 100.0 /100 | #8 | Exceptional 9.5% |
| Immigrants | Singapore | 100.0 /100 | #9 | Exceptional 9.5% |
| Immigrants | Israel | 100.0 /100 | #10 | Exceptional 9.6% |
| Immigrants | Eastern Asia | 100.0 /100 | #11 | Exceptional 9.6% |
| Bolivians | 100.0 /100 | #12 | Exceptional 9.6% |
| Iranians | 100.0 /100 | #13 | Exceptional 9.7% |
| Immigrants | Iran | 100.0 /100 | #14 | Exceptional 9.7% |
| Indians (Asian) | 100.0 /100 | #15 | Exceptional 9.7% |
| Okinawans | 100.0 /100 | #16 | Exceptional 9.8% |
| Immigrants | Korea | 100.0 /100 | #17 | Exceptional 9.8% |
| Immigrants | Pakistan | 100.0 /100 | #18 | Exceptional 9.8% |
| Immigrants | Sri Lanka | 100.0 /100 | #19 | Exceptional 10.0% |
| Asians | 100.0 /100 | #20 | Exceptional 10.0% |
| Burmese | 100.0 /100 | #21 | Exceptional 10.0% |
Demographics Similar to Cape Verdeans by Male Disability
In terms of male disability, the demographic groups most similar to Cape Verdeans are Scottish (12.8%, a difference of 0.070%), Welsh (12.7%, a difference of 0.12%), Spanish (12.7%, a difference of 0.13%), Yup'ik (12.8%, a difference of 0.19%), and Immigrants from Cabo Verde (12.8%, a difference of 0.38%).
| Demographics | Rating | Rank | Male Disability |
| Dutch | 0.0 /100 | #280 | Tragic 12.7% |
| Sioux | 0.0 /100 | #281 | Tragic 12.7% |
| Irish | 0.0 /100 | #282 | Tragic 12.7% |
| Germans | 0.0 /100 | #283 | Tragic 12.7% |
| Spanish | 0.0 /100 | #284 | Tragic 12.7% |
| Welsh | 0.0 /100 | #285 | Tragic 12.7% |
| Scottish | 0.0 /100 | #286 | Tragic 12.8% |
| Cape Verdeans | 0.0 /100 | #287 | Tragic 12.8% |
| Yup'ik | 0.0 /100 | #288 | Tragic 12.8% |
| Immigrants | Cabo Verde | 0.0 /100 | #289 | Tragic 12.8% |
| Pima | 0.0 /100 | #290 | Tragic 12.8% |
| Whites/Caucasians | 0.0 /100 | #291 | Tragic 12.8% |
| English | 0.0 /100 | #292 | Tragic 12.8% |
| Yaqui | 0.0 /100 | #293 | Tragic 12.9% |
| Marshallese | 0.0 /100 | #294 | Tragic 12.9% |