Immigrants from Indonesia vs Immigrants from China Female Disability
COMPARE
Immigrants from Indonesia
Immigrants from China
Female Disability
Female Disability Comparison
Immigrants from Indonesia
Immigrants from China
11.2%
FEMALE DISABILITY
100.0/ 100
METRIC RATING
34th/ 347
METRIC RANK
10.7%
FEMALE DISABILITY
100.0/ 100
METRIC RATING
14th/ 347
METRIC RANK
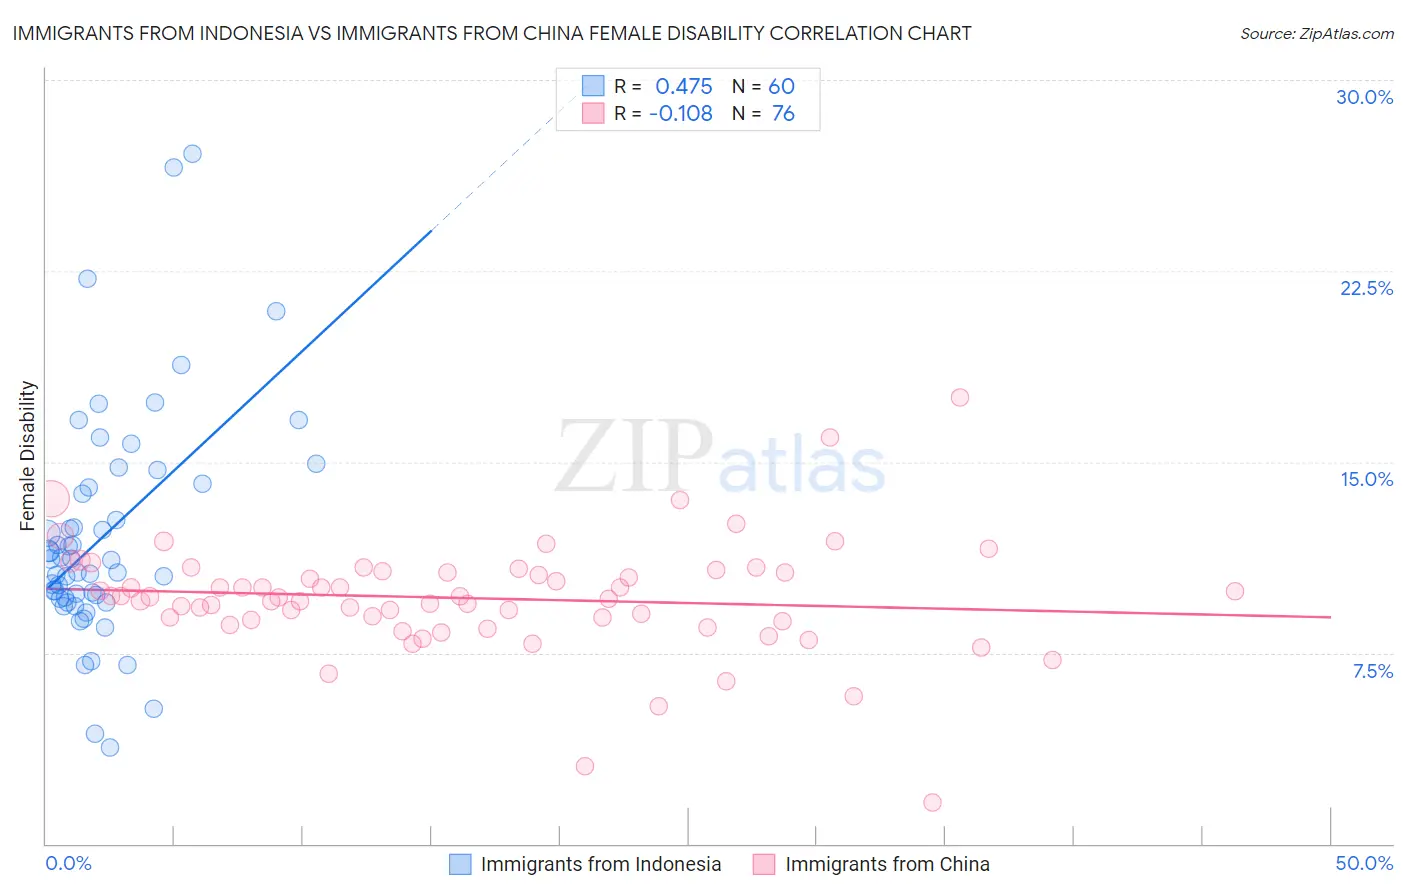
Immigrants from Indonesia vs Immigrants from China Female Disability Correlation Chart
The statistical analysis conducted on geographies consisting of 215,789,523 people shows a moderate positive correlation between the proportion of Immigrants from Indonesia and percentage of females with a disability in the United States with a correlation coefficient (R) of 0.475 and weighted average of 11.2%. Similarly, the statistical analysis conducted on geographies consisting of 457,020,371 people shows a poor negative correlation between the proportion of Immigrants from China and percentage of females with a disability in the United States with a correlation coefficient (R) of -0.108 and weighted average of 10.7%, a difference of 4.4%.
Female Disability Correlation Summary
| Measurement | Immigrants from Indonesia | Immigrants from China |
| Minimum | 3.8% | 1.6% |
| Maximum | 27.1% | 17.5% |
| Range | 23.3% | 15.9% |
| Mean | 12.1% | 9.6% |
| Median | 11.2% | 9.7% |
| Interquartile 25% (IQ1) | 9.7% | 8.8% |
| Interquartile 75% (IQ3) | 14.1% | 10.7% |
| Interquartile Range (IQR) | 4.4% | 1.9% |
| Standard Deviation (Sample) | 4.5% | 2.3% |
| Standard Deviation (Population) | 4.5% | 2.2% |
Demographics Similar to Immigrants from Indonesia and Immigrants from China by Female Disability
In terms of female disability, the demographic groups most similar to Immigrants from Indonesia are Immigrants from Egypt (11.1%, a difference of 0.25%), Immigrants from Australia (11.1%, a difference of 0.33%), Immigrants from Kuwait (11.1%, a difference of 0.50%), Immigrants from Malaysia (11.1%, a difference of 0.60%), and Turkish (11.1%, a difference of 0.60%). Similarly, the demographic groups most similar to Immigrants from China are Burmese (10.7%, a difference of 0.51%), Okinawan (10.8%, a difference of 0.58%), Indian (Asian) (10.8%, a difference of 0.90%), Immigrants from Iran (10.8%, a difference of 1.3%), and Immigrants from Venezuela (10.9%, a difference of 1.5%).
| Demographics | Rating | Rank | Female Disability |
| Immigrants | China | 100.0 /100 | #14 | Exceptional 10.7% |
| Burmese | 100.0 /100 | #15 | Exceptional 10.7% |
| Okinawans | 100.0 /100 | #16 | Exceptional 10.8% |
| Indians (Asian) | 100.0 /100 | #17 | Exceptional 10.8% |
| Immigrants | Iran | 100.0 /100 | #18 | Exceptional 10.8% |
| Immigrants | Venezuela | 100.0 /100 | #19 | Exceptional 10.9% |
| Immigrants | Pakistan | 100.0 /100 | #20 | Exceptional 10.9% |
| Asians | 100.0 /100 | #21 | Exceptional 10.9% |
| Immigrants | Sri Lanka | 100.0 /100 | #22 | Exceptional 10.9% |
| Venezuelans | 100.0 /100 | #23 | Exceptional 11.0% |
| Immigrants | Argentina | 100.0 /100 | #24 | Exceptional 11.0% |
| Immigrants | Asia | 100.0 /100 | #25 | Exceptional 11.0% |
| Argentineans | 100.0 /100 | #26 | Exceptional 11.0% |
| Immigrants | Turkey | 100.0 /100 | #27 | Exceptional 11.1% |
| Egyptians | 100.0 /100 | #28 | Exceptional 11.1% |
| Immigrants | Malaysia | 100.0 /100 | #29 | Exceptional 11.1% |
| Turks | 100.0 /100 | #30 | Exceptional 11.1% |
| Immigrants | Kuwait | 100.0 /100 | #31 | Exceptional 11.1% |
| Immigrants | Australia | 100.0 /100 | #32 | Exceptional 11.1% |
| Immigrants | Egypt | 100.0 /100 | #33 | Exceptional 11.1% |
| Immigrants | Indonesia | 100.0 /100 | #34 | Exceptional 11.2% |