Immigrants from India vs Serbian Female Disability
COMPARE
Immigrants from India
Serbian
Female Disability
Female Disability Comparison
Immigrants from India
Serbians
10.0%
FEMALE DISABILITY
100.0/ 100
METRIC RATING
1st/ 347
METRIC RANK
12.3%
FEMALE DISABILITY
33.1/ 100
METRIC RATING
187th/ 347
METRIC RANK
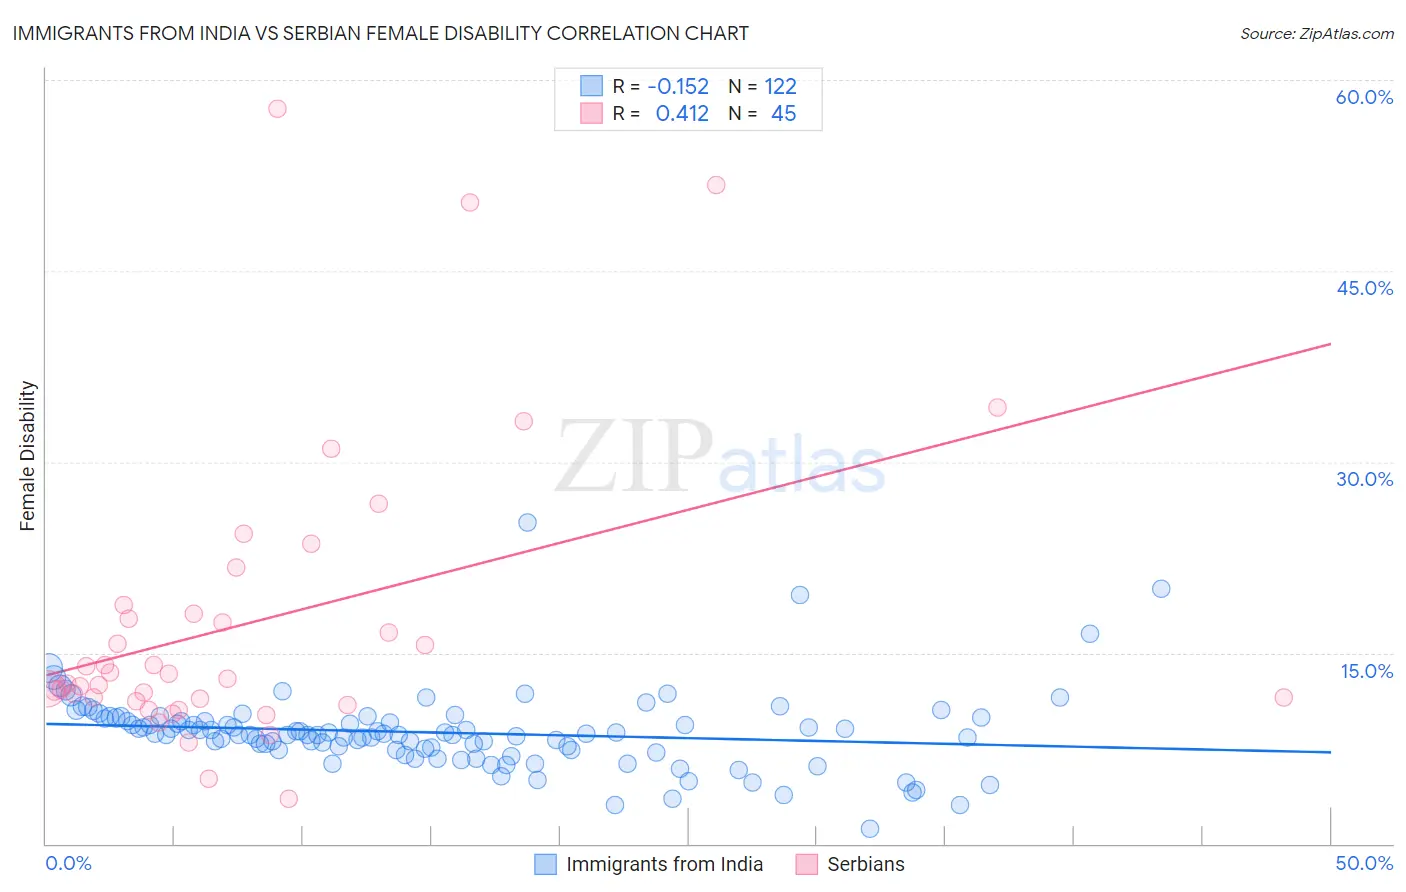
Immigrants from India vs Serbian Female Disability Correlation Chart
The statistical analysis conducted on geographies consisting of 434,078,720 people shows a poor negative correlation between the proportion of Immigrants from India and percentage of females with a disability in the United States with a correlation coefficient (R) of -0.152 and weighted average of 10.0%. Similarly, the statistical analysis conducted on geographies consisting of 267,642,282 people shows a moderate positive correlation between the proportion of Serbians and percentage of females with a disability in the United States with a correlation coefficient (R) of 0.412 and weighted average of 12.3%, a difference of 23.1%.
Female Disability Correlation Summary
| Measurement | Immigrants from India | Serbian |
| Minimum | 1.2% | 3.5% |
| Maximum | 25.3% | 57.7% |
| Range | 24.0% | 54.2% |
| Mean | 8.7% | 17.5% |
| Median | 8.6% | 12.9% |
| Interquartile 25% (IQ1) | 7.4% | 11.3% |
| Interquartile 75% (IQ3) | 9.8% | 18.4% |
| Interquartile Range (IQR) | 2.5% | 7.2% |
| Standard Deviation (Sample) | 3.1% | 11.8% |
| Standard Deviation (Population) | 3.1% | 11.6% |
Similar Demographics by Female Disability
Demographics Similar to Immigrants from India by Female Disability
In terms of female disability, the demographic groups most similar to Immigrants from India are Filipino (10.1%, a difference of 0.93%), Immigrants from Taiwan (10.1%, a difference of 1.2%), Thai (10.2%, a difference of 2.1%), Immigrants from Bolivia (10.3%, a difference of 2.9%), and Bolivian (10.4%, a difference of 3.8%).
| Demographics | Rating | Rank | Female Disability |
| Immigrants | India | 100.0 /100 | #1 | Exceptional 10.0% |
| Filipinos | 100.0 /100 | #2 | Exceptional 10.1% |
| Immigrants | Taiwan | 100.0 /100 | #3 | Exceptional 10.1% |
| Thais | 100.0 /100 | #4 | Exceptional 10.2% |
| Immigrants | Bolivia | 100.0 /100 | #5 | Exceptional 10.3% |
| Bolivians | 100.0 /100 | #6 | Exceptional 10.4% |
| Immigrants | Singapore | 100.0 /100 | #7 | Exceptional 10.4% |
| Immigrants | South Central Asia | 100.0 /100 | #8 | Exceptional 10.5% |
| Iranians | 100.0 /100 | #9 | Exceptional 10.6% |
| Immigrants | Hong Kong | 100.0 /100 | #10 | Exceptional 10.6% |
| Immigrants | Korea | 100.0 /100 | #11 | Exceptional 10.6% |
| Immigrants | Israel | 100.0 /100 | #12 | Exceptional 10.7% |
| Immigrants | Eastern Asia | 100.0 /100 | #13 | Exceptional 10.7% |
| Immigrants | China | 100.0 /100 | #14 | Exceptional 10.7% |
| Burmese | 100.0 /100 | #15 | Exceptional 10.7% |
Demographics Similar to Serbians by Female Disability
In terms of female disability, the demographic groups most similar to Serbians are Austrian (12.3%, a difference of 0.010%), Immigrants from North America (12.3%, a difference of 0.010%), Immigrants from Uzbekistan (12.3%, a difference of 0.030%), Immigrants from Albania (12.3%, a difference of 0.070%), and Immigrants from Honduras (12.3%, a difference of 0.080%).
| Demographics | Rating | Rank | Female Disability |
| Albanians | 37.9 /100 | #180 | Fair 12.3% |
| Immigrants | Canada | 37.2 /100 | #181 | Fair 12.3% |
| Norwegians | 36.9 /100 | #182 | Fair 12.3% |
| Cubans | 36.5 /100 | #183 | Fair 12.3% |
| Iraqis | 36.0 /100 | #184 | Fair 12.3% |
| Immigrants | Uzbekistan | 33.9 /100 | #185 | Fair 12.3% |
| Austrians | 33.3 /100 | #186 | Fair 12.3% |
| Serbians | 33.1 /100 | #187 | Fair 12.3% |
| Immigrants | North America | 32.8 /100 | #188 | Fair 12.3% |
| Immigrants | Albania | 31.6 /100 | #189 | Fair 12.3% |
| Immigrants | Honduras | 31.3 /100 | #190 | Fair 12.3% |
| Armenians | 29.7 /100 | #191 | Fair 12.3% |
| Immigrants | Western Africa | 29.2 /100 | #192 | Fair 12.3% |
| Northern Europeans | 27.5 /100 | #193 | Fair 12.3% |
| Ukrainians | 27.2 /100 | #194 | Fair 12.3% |