Immigrants from Nicaragua vs Serbian Female Disability
COMPARE
Immigrants from Nicaragua
Serbian
Female Disability
Female Disability Comparison
Immigrants from Nicaragua
Serbians
11.9%
FEMALE DISABILITY
94.5/ 100
METRIC RATING
134th/ 347
METRIC RANK
12.3%
FEMALE DISABILITY
33.1/ 100
METRIC RATING
187th/ 347
METRIC RANK
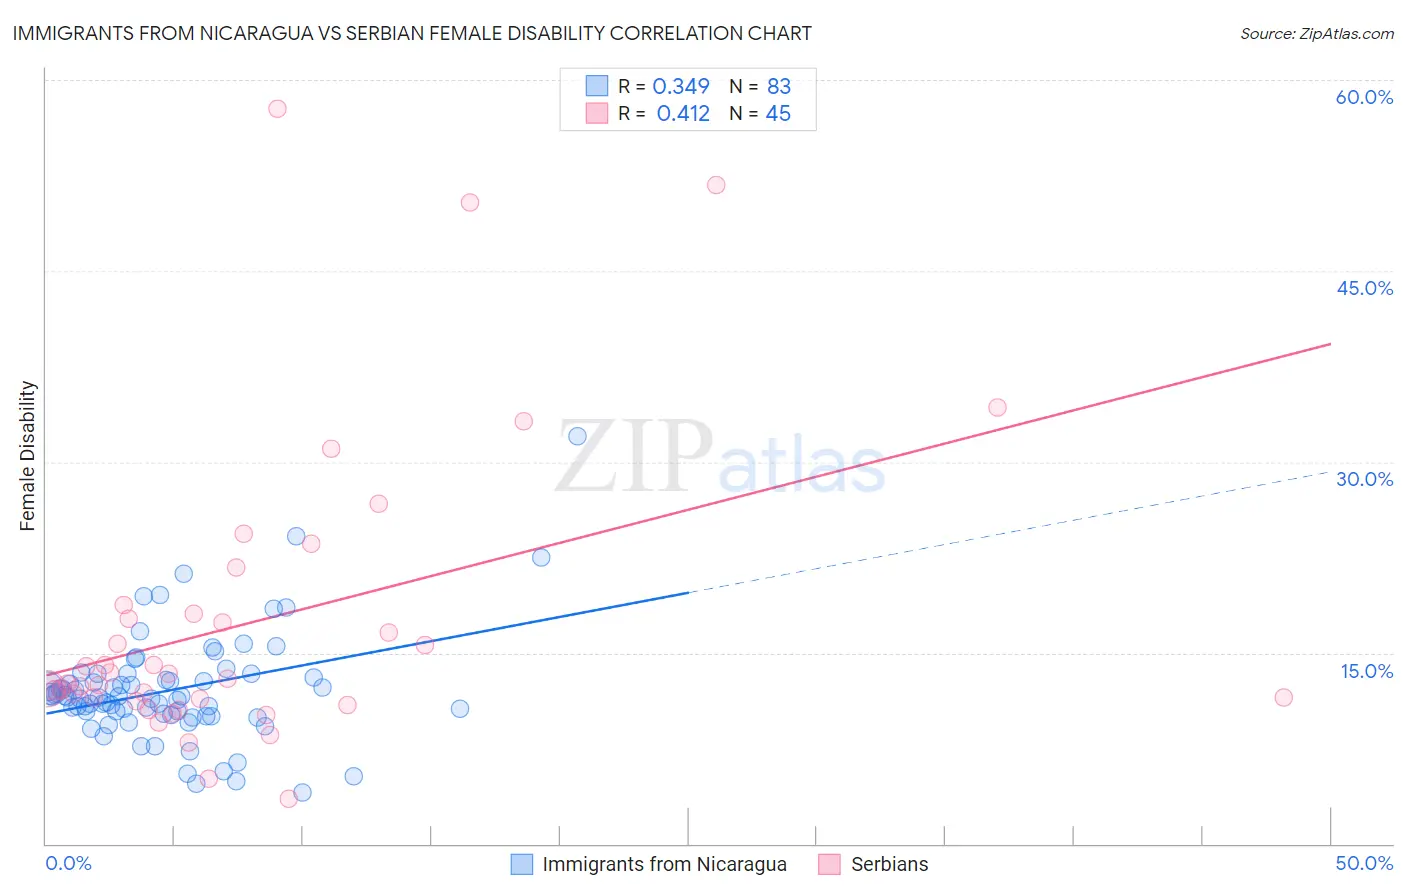
Immigrants from Nicaragua vs Serbian Female Disability Correlation Chart
The statistical analysis conducted on geographies consisting of 236,326,284 people shows a mild positive correlation between the proportion of Immigrants from Nicaragua and percentage of females with a disability in the United States with a correlation coefficient (R) of 0.349 and weighted average of 11.9%. Similarly, the statistical analysis conducted on geographies consisting of 267,642,282 people shows a moderate positive correlation between the proportion of Serbians and percentage of females with a disability in the United States with a correlation coefficient (R) of 0.412 and weighted average of 12.3%, a difference of 3.4%.
Female Disability Correlation Summary
| Measurement | Immigrants from Nicaragua | Serbian |
| Minimum | 4.0% | 3.5% |
| Maximum | 32.1% | 57.7% |
| Range | 28.0% | 54.2% |
| Mean | 12.1% | 17.5% |
| Median | 11.5% | 12.9% |
| Interquartile 25% (IQ1) | 10.1% | 11.3% |
| Interquartile 75% (IQ3) | 13.1% | 18.4% |
| Interquartile Range (IQR) | 2.9% | 7.2% |
| Standard Deviation (Sample) | 4.3% | 11.8% |
| Standard Deviation (Population) | 4.3% | 11.6% |
Similar Demographics by Female Disability
Demographics Similar to Immigrants from Nicaragua by Female Disability
In terms of female disability, the demographic groups most similar to Immigrants from Nicaragua are Kenyan (11.9%, a difference of 0.0%), Immigrants from Syria (11.9%, a difference of 0.010%), Central American (11.9%, a difference of 0.070%), Ugandan (11.9%, a difference of 0.090%), and Arab (11.9%, a difference of 0.11%).
| Demographics | Rating | Rank | Female Disability |
| South American Indians | 95.8 /100 | #127 | Exceptional 11.8% |
| Immigrants | Latvia | 95.6 /100 | #128 | Exceptional 11.8% |
| Macedonians | 95.5 /100 | #129 | Exceptional 11.8% |
| Nicaraguans | 95.2 /100 | #130 | Exceptional 11.9% |
| Arabs | 95.1 /100 | #131 | Exceptional 11.9% |
| Immigrants | Syria | 94.6 /100 | #132 | Exceptional 11.9% |
| Kenyans | 94.5 /100 | #133 | Exceptional 11.9% |
| Immigrants | Nicaragua | 94.5 /100 | #134 | Exceptional 11.9% |
| Central Americans | 94.2 /100 | #135 | Exceptional 11.9% |
| Ugandans | 94.0 /100 | #136 | Exceptional 11.9% |
| Immigrants | Norway | 93.8 /100 | #137 | Exceptional 11.9% |
| Ecuadorians | 93.4 /100 | #138 | Exceptional 11.9% |
| Immigrants | Hungary | 92.8 /100 | #139 | Exceptional 11.9% |
| Romanians | 91.6 /100 | #140 | Exceptional 11.9% |
| Immigrants | Ecuador | 91.5 /100 | #141 | Exceptional 11.9% |
Demographics Similar to Serbians by Female Disability
In terms of female disability, the demographic groups most similar to Serbians are Austrian (12.3%, a difference of 0.010%), Immigrants from North America (12.3%, a difference of 0.010%), Immigrants from Uzbekistan (12.3%, a difference of 0.030%), Immigrants from Albania (12.3%, a difference of 0.070%), and Immigrants from Honduras (12.3%, a difference of 0.080%).
| Demographics | Rating | Rank | Female Disability |
| Albanians | 37.9 /100 | #180 | Fair 12.3% |
| Immigrants | Canada | 37.2 /100 | #181 | Fair 12.3% |
| Norwegians | 36.9 /100 | #182 | Fair 12.3% |
| Cubans | 36.5 /100 | #183 | Fair 12.3% |
| Iraqis | 36.0 /100 | #184 | Fair 12.3% |
| Immigrants | Uzbekistan | 33.9 /100 | #185 | Fair 12.3% |
| Austrians | 33.3 /100 | #186 | Fair 12.3% |
| Serbians | 33.1 /100 | #187 | Fair 12.3% |
| Immigrants | North America | 32.8 /100 | #188 | Fair 12.3% |
| Immigrants | Albania | 31.6 /100 | #189 | Fair 12.3% |
| Immigrants | Honduras | 31.3 /100 | #190 | Fair 12.3% |
| Armenians | 29.7 /100 | #191 | Fair 12.3% |
| Immigrants | Western Africa | 29.2 /100 | #192 | Fair 12.3% |
| Northern Europeans | 27.5 /100 | #193 | Fair 12.3% |
| Ukrainians | 27.2 /100 | #194 | Fair 12.3% |