Albanian vs Serbian Female Disability
COMPARE
Albanian
Serbian
Female Disability
Female Disability Comparison
Albanians
Serbians
12.3%
FEMALE DISABILITY
37.9/ 100
METRIC RATING
180th/ 347
METRIC RANK
12.3%
FEMALE DISABILITY
33.1/ 100
METRIC RATING
187th/ 347
METRIC RANK
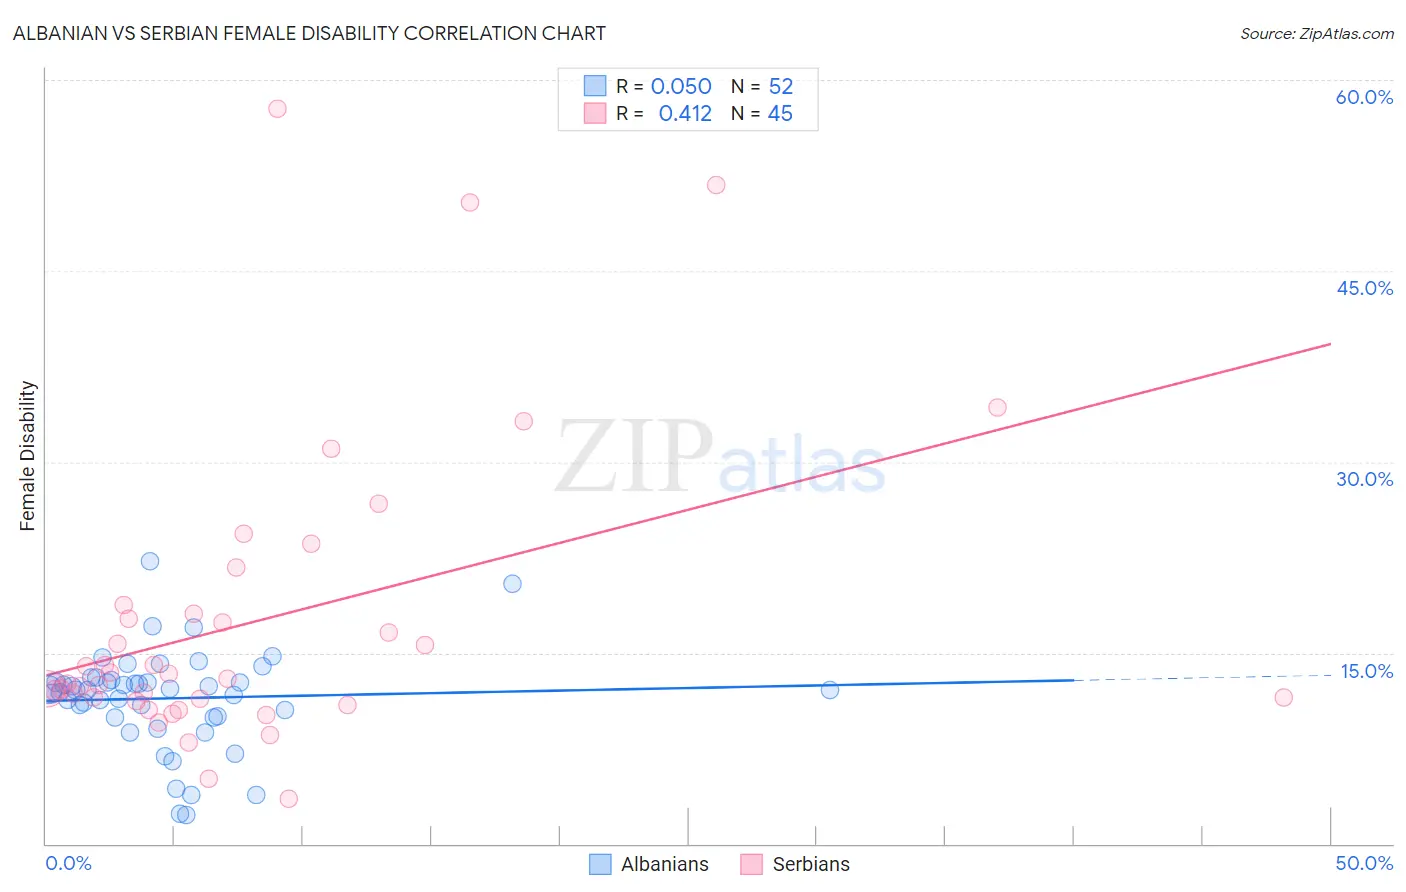
Albanian vs Serbian Female Disability Correlation Chart
The statistical analysis conducted on geographies consisting of 193,264,096 people shows no correlation between the proportion of Albanians and percentage of females with a disability in the United States with a correlation coefficient (R) of 0.050 and weighted average of 12.3%. Similarly, the statistical analysis conducted on geographies consisting of 267,642,282 people shows a moderate positive correlation between the proportion of Serbians and percentage of females with a disability in the United States with a correlation coefficient (R) of 0.412 and weighted average of 12.3%, a difference of 0.20%.
Female Disability Correlation Summary
| Measurement | Albanian | Serbian |
| Minimum | 2.3% | 3.5% |
| Maximum | 22.2% | 57.7% |
| Range | 20.0% | 54.2% |
| Mean | 11.4% | 17.5% |
| Median | 12.1% | 12.9% |
| Interquartile 25% (IQ1) | 10.0% | 11.3% |
| Interquartile 75% (IQ3) | 12.8% | 18.4% |
| Interquartile Range (IQR) | 2.8% | 7.2% |
| Standard Deviation (Sample) | 3.9% | 11.8% |
| Standard Deviation (Population) | 3.8% | 11.6% |
Demographics Similar to Albanians and Serbians by Female Disability
In terms of female disability, the demographic groups most similar to Albanians are Immigrants from Fiji (12.3%, a difference of 0.010%), Immigrants from Canada (12.3%, a difference of 0.030%), Norwegian (12.3%, a difference of 0.040%), Cuban (12.3%, a difference of 0.060%), and Iraqi (12.3%, a difference of 0.080%). Similarly, the demographic groups most similar to Serbians are Austrian (12.3%, a difference of 0.010%), Immigrants from North America (12.3%, a difference of 0.010%), Immigrants from Uzbekistan (12.3%, a difference of 0.030%), Immigrants from Albania (12.3%, a difference of 0.070%), and Immigrants from Honduras (12.3%, a difference of 0.080%).
| Demographics | Rating | Rank | Female Disability |
| Immigrants | Mexico | 50.8 /100 | #173 | Average 12.2% |
| Immigrants | England | 50.0 /100 | #174 | Average 12.2% |
| Immigrants | St. Vincent and the Grenadines | 49.7 /100 | #175 | Average 12.2% |
| Immigrants | Guyana | 43.1 /100 | #176 | Average 12.2% |
| Immigrants | Ghana | 42.5 /100 | #177 | Average 12.2% |
| Immigrants | Western Europe | 40.9 /100 | #178 | Average 12.2% |
| Immigrants | Fiji | 38.2 /100 | #179 | Fair 12.3% |
| Albanians | 37.9 /100 | #180 | Fair 12.3% |
| Immigrants | Canada | 37.2 /100 | #181 | Fair 12.3% |
| Norwegians | 36.9 /100 | #182 | Fair 12.3% |
| Cubans | 36.5 /100 | #183 | Fair 12.3% |
| Iraqis | 36.0 /100 | #184 | Fair 12.3% |
| Immigrants | Uzbekistan | 33.9 /100 | #185 | Fair 12.3% |
| Austrians | 33.3 /100 | #186 | Fair 12.3% |
| Serbians | 33.1 /100 | #187 | Fair 12.3% |
| Immigrants | North America | 32.8 /100 | #188 | Fair 12.3% |
| Immigrants | Albania | 31.6 /100 | #189 | Fair 12.3% |
| Immigrants | Honduras | 31.3 /100 | #190 | Fair 12.3% |
| Armenians | 29.7 /100 | #191 | Fair 12.3% |
| Immigrants | Western Africa | 29.2 /100 | #192 | Fair 12.3% |
| Northern Europeans | 27.5 /100 | #193 | Fair 12.3% |