Immigrants from India vs Immigrants Female Disability
COMPARE
Immigrants from India
Immigrants
Female Disability
Female Disability Comparison
Immigrants from India
Immigrants
10.0%
FEMALE DISABILITY
100.0/ 100
METRIC RATING
1st/ 347
METRIC RANK
11.7%
FEMALE DISABILITY
98.1/ 100
METRIC RATING
109th/ 347
METRIC RANK
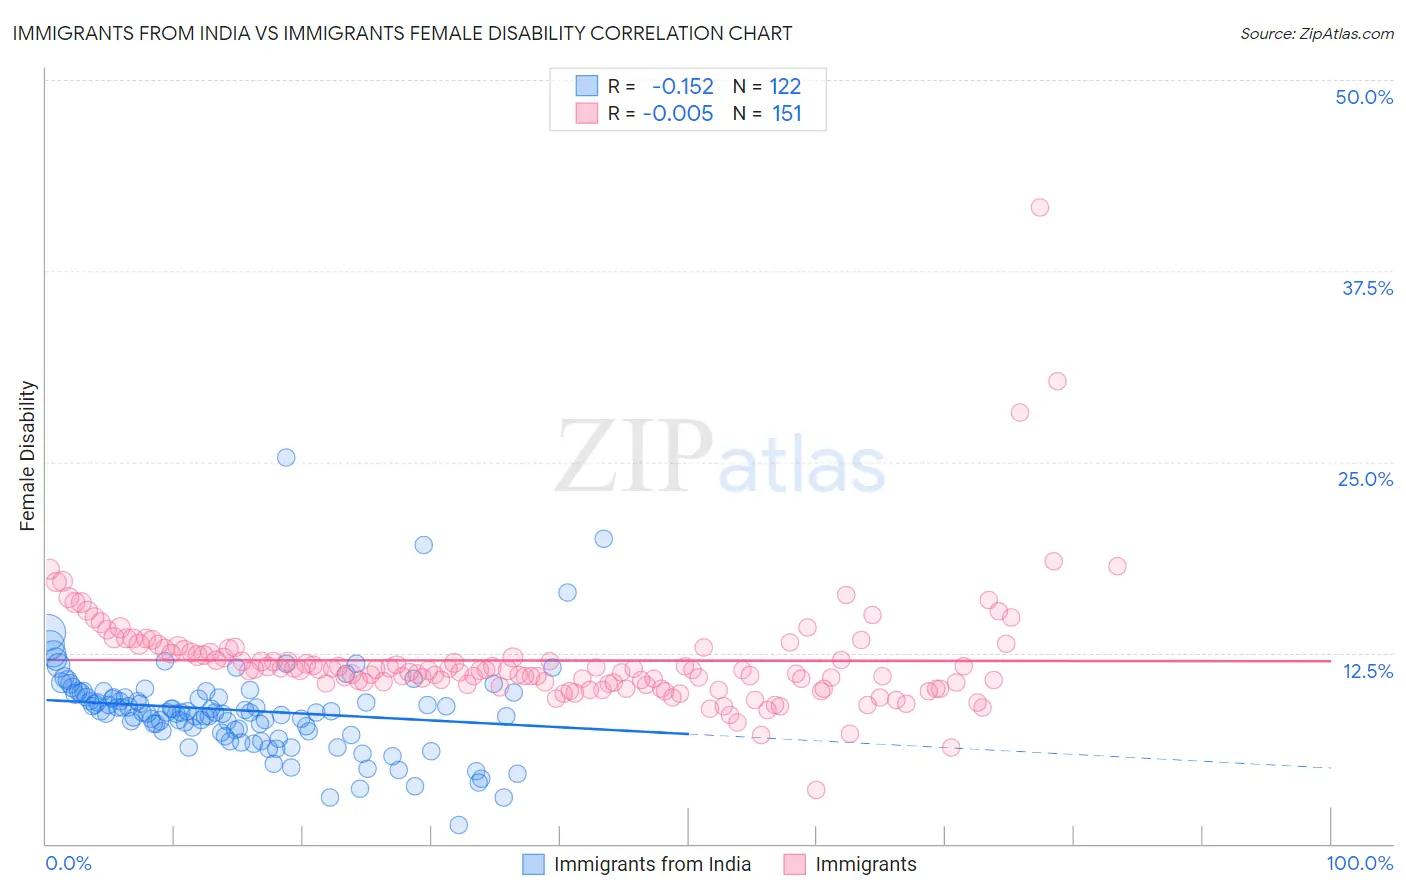
Immigrants from India vs Immigrants Female Disability Correlation Chart
The statistical analysis conducted on geographies consisting of 434,078,720 people shows a poor negative correlation between the proportion of Immigrants from India and percentage of females with a disability in the United States with a correlation coefficient (R) of -0.152 and weighted average of 10.0%. Similarly, the statistical analysis conducted on geographies consisting of 577,392,007 people shows no correlation between the proportion of Immigrants and percentage of females with a disability in the United States with a correlation coefficient (R) of -0.005 and weighted average of 11.7%, a difference of 17.8%.
Female Disability Correlation Summary
| Measurement | Immigrants from India | Immigrants |
| Minimum | 1.2% | 3.5% |
| Maximum | 25.3% | 41.7% |
| Range | 24.0% | 38.2% |
| Mean | 8.7% | 12.0% |
| Median | 8.6% | 11.4% |
| Interquartile 25% (IQ1) | 7.4% | 10.4% |
| Interquartile 75% (IQ3) | 9.8% | 12.7% |
| Interquartile Range (IQR) | 2.5% | 2.2% |
| Standard Deviation (Sample) | 3.1% | 3.9% |
| Standard Deviation (Population) | 3.1% | 3.8% |
Similar Demographics by Female Disability
Demographics Similar to Immigrants from India by Female Disability
In terms of female disability, the demographic groups most similar to Immigrants from India are Filipino (10.1%, a difference of 0.93%), Immigrants from Taiwan (10.1%, a difference of 1.2%), Thai (10.2%, a difference of 2.1%), Immigrants from Bolivia (10.3%, a difference of 2.9%), and Bolivian (10.4%, a difference of 3.8%).
| Demographics | Rating | Rank | Female Disability |
| Immigrants | India | 100.0 /100 | #1 | Exceptional 10.0% |
| Filipinos | 100.0 /100 | #2 | Exceptional 10.1% |
| Immigrants | Taiwan | 100.0 /100 | #3 | Exceptional 10.1% |
| Thais | 100.0 /100 | #4 | Exceptional 10.2% |
| Immigrants | Bolivia | 100.0 /100 | #5 | Exceptional 10.3% |
| Bolivians | 100.0 /100 | #6 | Exceptional 10.4% |
| Immigrants | Singapore | 100.0 /100 | #7 | Exceptional 10.4% |
| Immigrants | South Central Asia | 100.0 /100 | #8 | Exceptional 10.5% |
| Iranians | 100.0 /100 | #9 | Exceptional 10.6% |
| Immigrants | Hong Kong | 100.0 /100 | #10 | Exceptional 10.6% |
| Immigrants | Korea | 100.0 /100 | #11 | Exceptional 10.6% |
| Immigrants | Israel | 100.0 /100 | #12 | Exceptional 10.7% |
| Immigrants | Eastern Asia | 100.0 /100 | #13 | Exceptional 10.7% |
| Immigrants | China | 100.0 /100 | #14 | Exceptional 10.7% |
| Burmese | 100.0 /100 | #15 | Exceptional 10.7% |
Demographics Similar to Immigrants by Female Disability
In terms of female disability, the demographic groups most similar to Immigrants are Soviet Union (11.7%, a difference of 0.0%), Costa Rican (11.7%, a difference of 0.020%), New Zealander (11.7%, a difference of 0.030%), Latvian (11.7%, a difference of 0.050%), and Immigrants from Greece (11.7%, a difference of 0.080%).
| Demographics | Rating | Rank | Female Disability |
| Immigrants | South Eastern Asia | 98.4 /100 | #102 | Exceptional 11.7% |
| Immigrants | Eastern Africa | 98.3 /100 | #103 | Exceptional 11.7% |
| Immigrants | Western Asia | 98.3 /100 | #104 | Exceptional 11.7% |
| Australians | 98.3 /100 | #105 | Exceptional 11.7% |
| Immigrants | Greece | 98.2 /100 | #106 | Exceptional 11.7% |
| Latvians | 98.2 /100 | #107 | Exceptional 11.7% |
| New Zealanders | 98.1 /100 | #108 | Exceptional 11.7% |
| Immigrants | Immigrants | 98.1 /100 | #109 | Exceptional 11.7% |
| Soviet Union | 98.1 /100 | #110 | Exceptional 11.7% |
| Costa Ricans | 98.1 /100 | #111 | Exceptional 11.7% |
| Immigrants | Bangladesh | 97.8 /100 | #112 | Exceptional 11.8% |
| Immigrants | Belarus | 97.8 /100 | #113 | Exceptional 11.8% |
| South Africans | 97.7 /100 | #114 | Exceptional 11.8% |
| Brazilians | 97.7 /100 | #115 | Exceptional 11.8% |
| Immigrants | Morocco | 97.6 /100 | #116 | Exceptional 11.8% |