Immigrants from India vs Immigrants from Burma/Myanmar Self-Care Disability
COMPARE
Immigrants from India
Immigrants from Burma/Myanmar
Self-Care Disability
Self-Care Disability Comparison
Immigrants from India
Immigrants from Burma/Myanmar
2.0%
SELF-CARE DISABILITY
100.0/ 100
METRIC RATING
2nd/ 347
METRIC RANK
2.5%
SELF-CARE DISABILITY
52.8/ 100
METRIC RATING
173rd/ 347
METRIC RANK
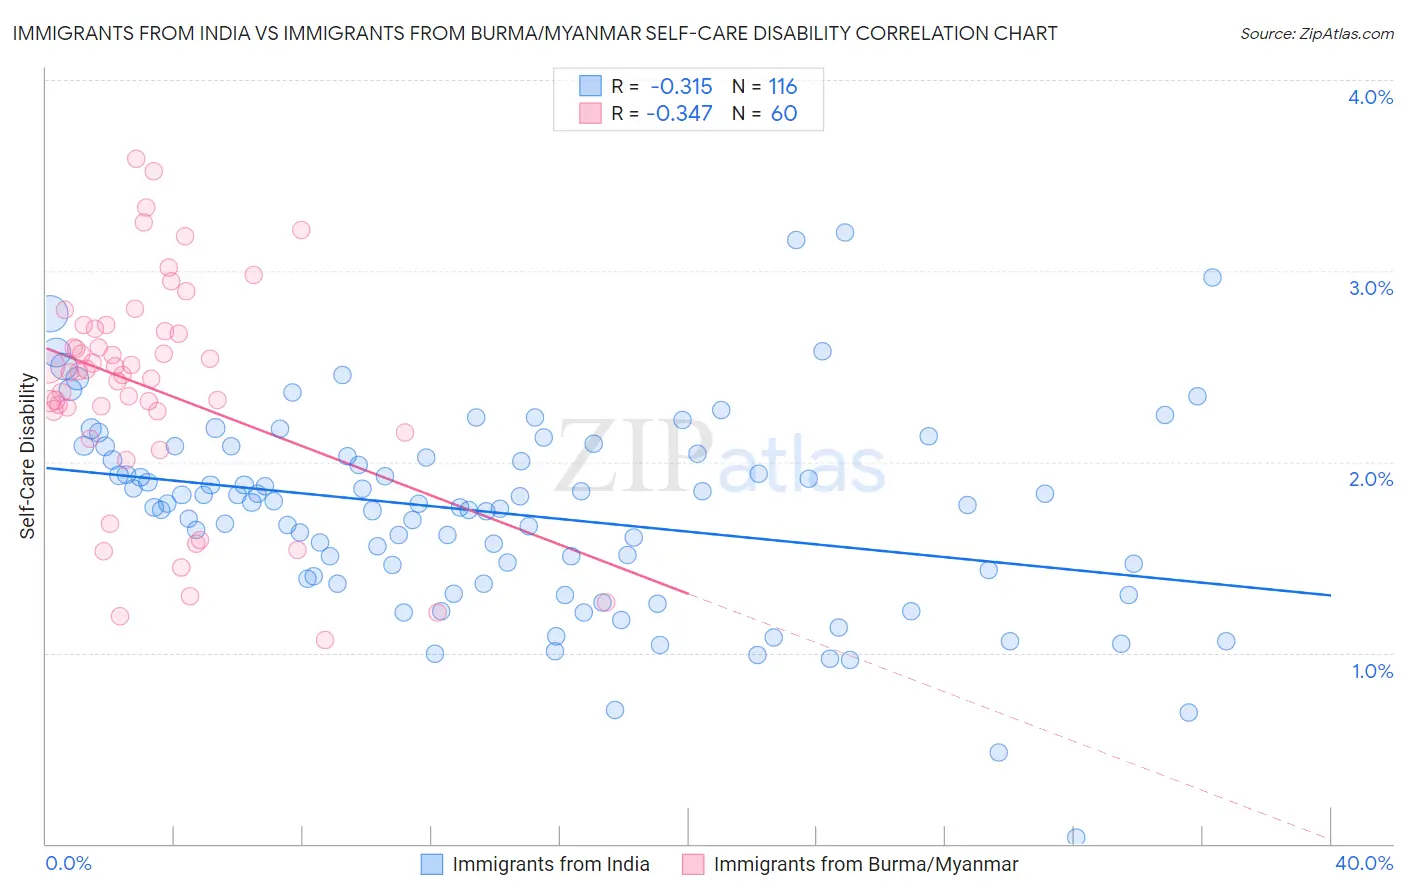
Immigrants from India vs Immigrants from Burma/Myanmar Self-Care Disability Correlation Chart
The statistical analysis conducted on geographies consisting of 433,462,707 people shows a mild negative correlation between the proportion of Immigrants from India and percentage of population with self-care disability in the United States with a correlation coefficient (R) of -0.315 and weighted average of 2.0%. Similarly, the statistical analysis conducted on geographies consisting of 172,240,034 people shows a mild negative correlation between the proportion of Immigrants from Burma/Myanmar and percentage of population with self-care disability in the United States with a correlation coefficient (R) of -0.347 and weighted average of 2.5%, a difference of 22.0%.
Self-Care Disability Correlation Summary
| Measurement | Immigrants from India | Immigrants from Burma/Myanmar |
| Minimum | 0.030% | 1.1% |
| Maximum | 3.2% | 3.6% |
| Range | 3.2% | 2.5% |
| Mean | 1.7% | 2.4% |
| Median | 1.8% | 2.5% |
| Interquartile 25% (IQ1) | 1.4% | 2.2% |
| Interquartile 75% (IQ3) | 2.0% | 2.7% |
| Interquartile Range (IQR) | 0.64% | 0.48% |
| Standard Deviation (Sample) | 0.52% | 0.58% |
| Standard Deviation (Population) | 0.52% | 0.57% |
Similar Demographics by Self-Care Disability
Demographics Similar to Immigrants from India by Self-Care Disability
In terms of self-care disability, the demographic groups most similar to Immigrants from India are Thai (2.1%, a difference of 3.0%), Immigrants from Singapore (2.1%, a difference of 5.4%), Zimbabwean (2.2%, a difference of 6.5%), Filipino (2.2%, a difference of 6.7%), and Immigrants from Bolivia (2.2%, a difference of 6.9%).
| Demographics | Rating | Rank | Self-Care Disability |
| Yup'ik | 100.0 /100 | #1 | Exceptional 1.9% |
| Immigrants | India | 100.0 /100 | #2 | Exceptional 2.0% |
| Thais | 100.0 /100 | #3 | Exceptional 2.1% |
| Immigrants | Singapore | 100.0 /100 | #4 | Exceptional 2.1% |
| Zimbabweans | 100.0 /100 | #5 | Exceptional 2.2% |
| Filipinos | 100.0 /100 | #6 | Exceptional 2.2% |
| Immigrants | Bolivia | 100.0 /100 | #7 | Exceptional 2.2% |
| Bolivians | 100.0 /100 | #8 | Exceptional 2.2% |
| Immigrants | Nepal | 100.0 /100 | #9 | Exceptional 2.2% |
| Sudanese | 100.0 /100 | #10 | Exceptional 2.2% |
| Immigrants | South Central Asia | 100.0 /100 | #11 | Exceptional 2.2% |
| Immigrants | Ethiopia | 100.0 /100 | #12 | Exceptional 2.2% |
| Ethiopians | 100.0 /100 | #13 | Exceptional 2.2% |
| Luxembourgers | 100.0 /100 | #14 | Exceptional 2.2% |
| Okinawans | 100.0 /100 | #15 | Exceptional 2.2% |
Demographics Similar to Immigrants from Burma/Myanmar by Self-Care Disability
In terms of self-care disability, the demographic groups most similar to Immigrants from Burma/Myanmar are Pennsylvania German (2.5%, a difference of 0.030%), Czechoslovakian (2.5%, a difference of 0.030%), Scottish (2.5%, a difference of 0.070%), Welsh (2.5%, a difference of 0.13%), and Immigrants from Somalia (2.5%, a difference of 0.15%).
| Demographics | Rating | Rank | Self-Care Disability |
| Canadians | 58.8 /100 | #166 | Average 2.5% |
| Immigrants | Greece | 57.3 /100 | #167 | Average 2.5% |
| Ute | 57.1 /100 | #168 | Average 2.5% |
| Immigrants | Somalia | 55.9 /100 | #169 | Average 2.5% |
| Scottish | 54.3 /100 | #170 | Average 2.5% |
| Pennsylvania Germans | 53.5 /100 | #171 | Average 2.5% |
| Czechoslovakians | 53.5 /100 | #172 | Average 2.5% |
| Immigrants | Burma/Myanmar | 52.8 /100 | #173 | Average 2.5% |
| Welsh | 50.0 /100 | #174 | Average 2.5% |
| Immigrants | Bosnia and Herzegovina | 49.6 /100 | #175 | Average 2.5% |
| Immigrants | Afghanistan | 47.6 /100 | #176 | Average 2.5% |
| Immigrants | Kazakhstan | 46.7 /100 | #177 | Average 2.5% |
| English | 46.2 /100 | #178 | Average 2.5% |
| Hungarians | 45.5 /100 | #179 | Average 2.5% |
| Indonesians | 41.2 /100 | #180 | Average 2.5% |