Immigrants from Yemen vs Immigrants from Burma/Myanmar Self-Care Disability
COMPARE
Immigrants from Yemen
Immigrants from Burma/Myanmar
Self-Care Disability
Self-Care Disability Comparison
Immigrants from Yemen
Immigrants from Burma/Myanmar
3.0%
SELF-CARE DISABILITY
0.0/ 100
METRIC RATING
336th/ 347
METRIC RANK
2.5%
SELF-CARE DISABILITY
52.8/ 100
METRIC RATING
173rd/ 347
METRIC RANK
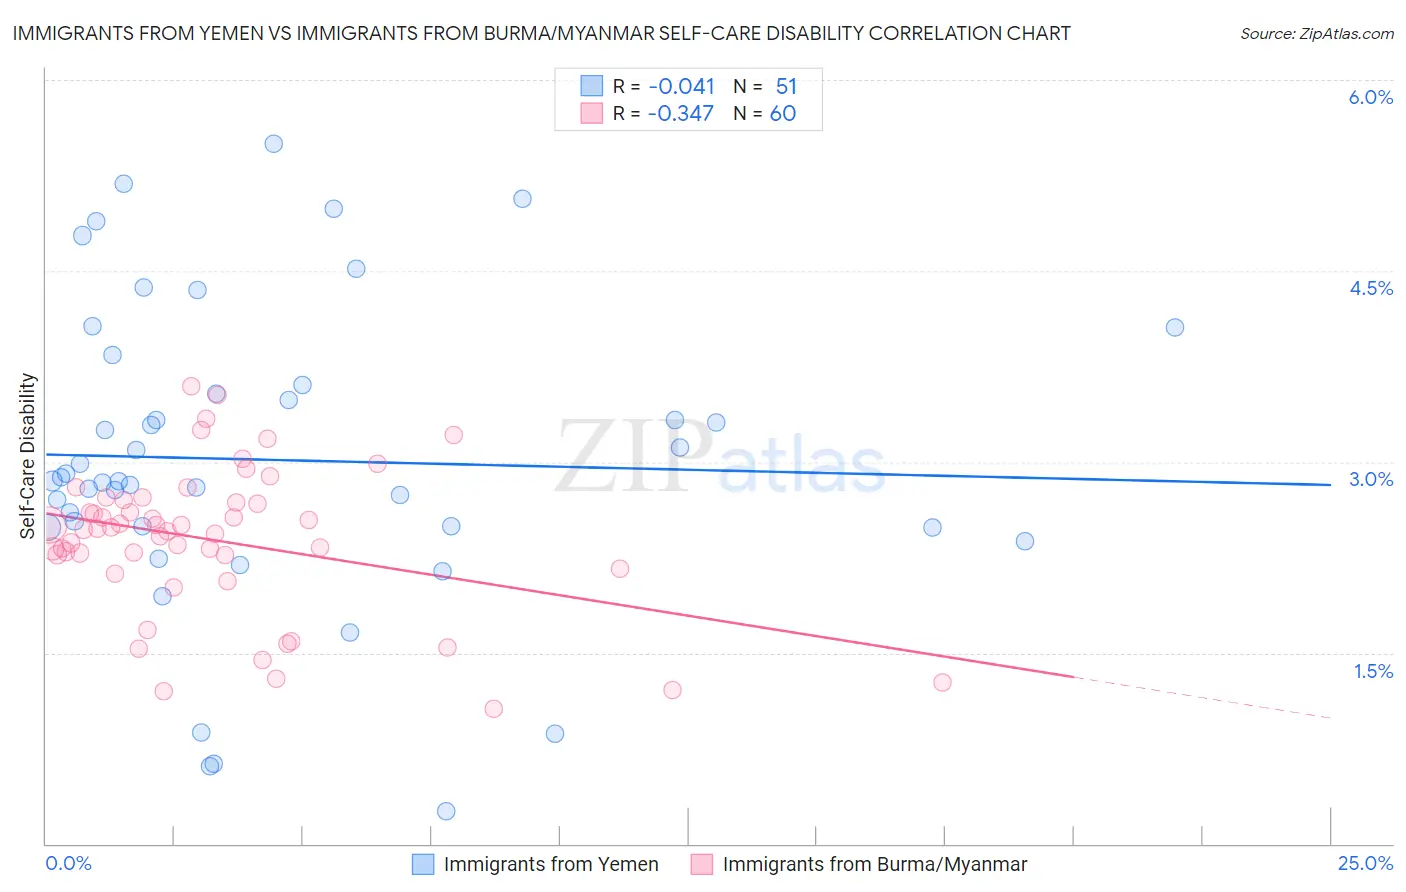
Immigrants from Yemen vs Immigrants from Burma/Myanmar Self-Care Disability Correlation Chart
The statistical analysis conducted on geographies consisting of 82,420,060 people shows no correlation between the proportion of Immigrants from Yemen and percentage of population with self-care disability in the United States with a correlation coefficient (R) of -0.041 and weighted average of 3.0%. Similarly, the statistical analysis conducted on geographies consisting of 172,240,034 people shows a mild negative correlation between the proportion of Immigrants from Burma/Myanmar and percentage of population with self-care disability in the United States with a correlation coefficient (R) of -0.347 and weighted average of 2.5%, a difference of 21.5%.
Self-Care Disability Correlation Summary
| Measurement | Immigrants from Yemen | Immigrants from Burma/Myanmar |
| Minimum | 0.26% | 1.1% |
| Maximum | 5.5% | 3.6% |
| Range | 5.2% | 2.5% |
| Mean | 3.0% | 2.4% |
| Median | 2.8% | 2.5% |
| Interquartile 25% (IQ1) | 2.5% | 2.2% |
| Interquartile 75% (IQ3) | 3.6% | 2.7% |
| Interquartile Range (IQR) | 1.1% | 0.48% |
| Standard Deviation (Sample) | 1.2% | 0.58% |
| Standard Deviation (Population) | 1.2% | 0.57% |
Similar Demographics by Self-Care Disability
Demographics Similar to Immigrants from Yemen by Self-Care Disability
In terms of self-care disability, the demographic groups most similar to Immigrants from Yemen are Immigrants from the Azores (3.0%, a difference of 0.16%), Houma (3.0%, a difference of 0.21%), Dutch West Indian (3.0%, a difference of 0.28%), Kiowa (3.0%, a difference of 0.51%), and Lumbee (3.0%, a difference of 0.87%).
| Demographics | Rating | Rank | Self-Care Disability |
| Cajuns | 0.0 /100 | #329 | Tragic 2.9% |
| Nepalese | 0.0 /100 | #330 | Tragic 3.0% |
| Lumbee | 0.0 /100 | #331 | Tragic 3.0% |
| Kiowa | 0.0 /100 | #332 | Tragic 3.0% |
| Dutch West Indians | 0.0 /100 | #333 | Tragic 3.0% |
| Houma | 0.0 /100 | #334 | Tragic 3.0% |
| Immigrants | Azores | 0.0 /100 | #335 | Tragic 3.0% |
| Immigrants | Yemen | 0.0 /100 | #336 | Tragic 3.0% |
| Choctaw | 0.0 /100 | #337 | Tragic 3.0% |
| Cape Verdeans | 0.0 /100 | #338 | Tragic 3.0% |
| Immigrants | Dominican Republic | 0.0 /100 | #339 | Tragic 3.0% |
| Immigrants | Cabo Verde | 0.0 /100 | #340 | Tragic 3.1% |
| Dominicans | 0.0 /100 | #341 | Tragic 3.1% |
| Colville | 0.0 /100 | #342 | Tragic 3.1% |
| Tohono O'odham | 0.0 /100 | #343 | Tragic 3.1% |
Demographics Similar to Immigrants from Burma/Myanmar by Self-Care Disability
In terms of self-care disability, the demographic groups most similar to Immigrants from Burma/Myanmar are Pennsylvania German (2.5%, a difference of 0.030%), Czechoslovakian (2.5%, a difference of 0.030%), Scottish (2.5%, a difference of 0.070%), Welsh (2.5%, a difference of 0.13%), and Immigrants from Somalia (2.5%, a difference of 0.15%).
| Demographics | Rating | Rank | Self-Care Disability |
| Canadians | 58.8 /100 | #166 | Average 2.5% |
| Immigrants | Greece | 57.3 /100 | #167 | Average 2.5% |
| Ute | 57.1 /100 | #168 | Average 2.5% |
| Immigrants | Somalia | 55.9 /100 | #169 | Average 2.5% |
| Scottish | 54.3 /100 | #170 | Average 2.5% |
| Pennsylvania Germans | 53.5 /100 | #171 | Average 2.5% |
| Czechoslovakians | 53.5 /100 | #172 | Average 2.5% |
| Immigrants | Burma/Myanmar | 52.8 /100 | #173 | Average 2.5% |
| Welsh | 50.0 /100 | #174 | Average 2.5% |
| Immigrants | Bosnia and Herzegovina | 49.6 /100 | #175 | Average 2.5% |
| Immigrants | Afghanistan | 47.6 /100 | #176 | Average 2.5% |
| Immigrants | Kazakhstan | 46.7 /100 | #177 | Average 2.5% |
| English | 46.2 /100 | #178 | Average 2.5% |
| Hungarians | 45.5 /100 | #179 | Average 2.5% |
| Indonesians | 41.2 /100 | #180 | Average 2.5% |