Immigrants from India vs Immigrants from Saudi Arabia Self-Care Disability
COMPARE
Immigrants from India
Immigrants from Saudi Arabia
Self-Care Disability
Self-Care Disability Comparison
Immigrants from India
Immigrants from Saudi Arabia
2.0%
SELF-CARE DISABILITY
100.0/ 100
METRIC RATING
2nd/ 347
METRIC RANK
2.2%
SELF-CARE DISABILITY
100.0/ 100
METRIC RATING
17th/ 347
METRIC RANK
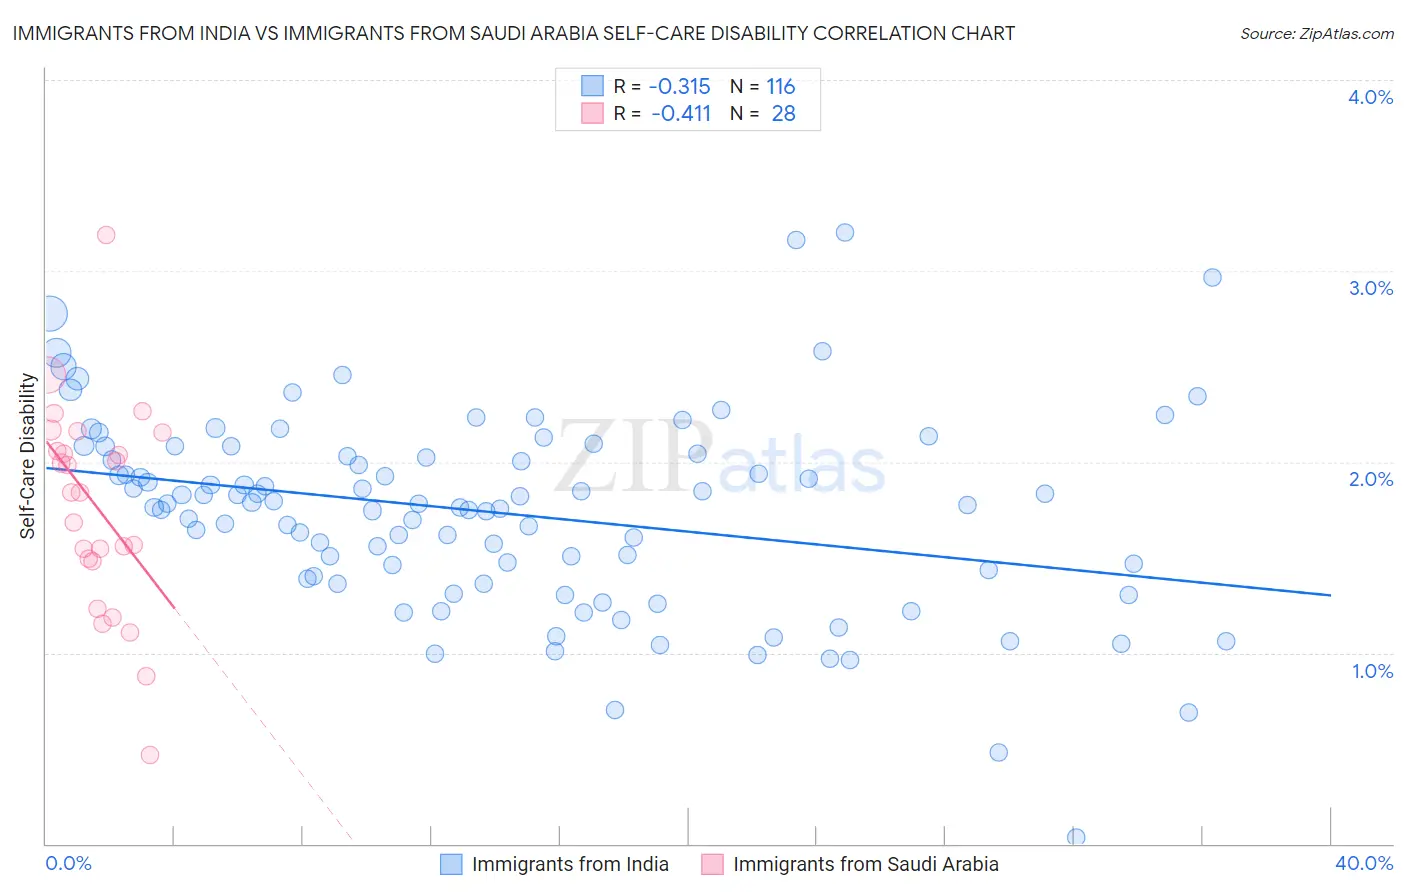
Immigrants from India vs Immigrants from Saudi Arabia Self-Care Disability Correlation Chart
The statistical analysis conducted on geographies consisting of 433,462,707 people shows a mild negative correlation between the proportion of Immigrants from India and percentage of population with self-care disability in the United States with a correlation coefficient (R) of -0.315 and weighted average of 2.0%. Similarly, the statistical analysis conducted on geographies consisting of 164,197,287 people shows a moderate negative correlation between the proportion of Immigrants from Saudi Arabia and percentage of population with self-care disability in the United States with a correlation coefficient (R) of -0.411 and weighted average of 2.2%, a difference of 9.3%.
Self-Care Disability Correlation Summary
| Measurement | Immigrants from India | Immigrants from Saudi Arabia |
| Minimum | 0.030% | 0.47% |
| Maximum | 3.2% | 3.2% |
| Range | 3.2% | 2.7% |
| Mean | 1.7% | 1.8% |
| Median | 1.8% | 1.8% |
| Interquartile 25% (IQ1) | 1.4% | 1.5% |
| Interquartile 75% (IQ3) | 2.0% | 2.1% |
| Interquartile Range (IQR) | 0.64% | 0.62% |
| Standard Deviation (Sample) | 0.52% | 0.55% |
| Standard Deviation (Population) | 0.52% | 0.54% |
Demographics Similar to Immigrants from India and Immigrants from Saudi Arabia by Self-Care Disability
In terms of self-care disability, the demographic groups most similar to Immigrants from India are Thai (2.1%, a difference of 3.0%), Immigrants from Singapore (2.1%, a difference of 5.4%), Zimbabwean (2.2%, a difference of 6.5%), Filipino (2.2%, a difference of 6.7%), and Immigrants from Bolivia (2.2%, a difference of 6.9%). Similarly, the demographic groups most similar to Immigrants from Saudi Arabia are Immigrants from Kuwait (2.2%, a difference of 0.16%), Immigrants from Taiwan (2.2%, a difference of 0.25%), Okinawan (2.2%, a difference of 0.44%), Luxembourger (2.2%, a difference of 0.45%), and Immigrants from Eritrea (2.2%, a difference of 0.59%).
| Demographics | Rating | Rank | Self-Care Disability |
| Yup'ik | 100.0 /100 | #1 | Exceptional 1.9% |
| Immigrants | India | 100.0 /100 | #2 | Exceptional 2.0% |
| Thais | 100.0 /100 | #3 | Exceptional 2.1% |
| Immigrants | Singapore | 100.0 /100 | #4 | Exceptional 2.1% |
| Zimbabweans | 100.0 /100 | #5 | Exceptional 2.2% |
| Filipinos | 100.0 /100 | #6 | Exceptional 2.2% |
| Immigrants | Bolivia | 100.0 /100 | #7 | Exceptional 2.2% |
| Bolivians | 100.0 /100 | #8 | Exceptional 2.2% |
| Immigrants | Nepal | 100.0 /100 | #9 | Exceptional 2.2% |
| Sudanese | 100.0 /100 | #10 | Exceptional 2.2% |
| Immigrants | South Central Asia | 100.0 /100 | #11 | Exceptional 2.2% |
| Immigrants | Ethiopia | 100.0 /100 | #12 | Exceptional 2.2% |
| Ethiopians | 100.0 /100 | #13 | Exceptional 2.2% |
| Luxembourgers | 100.0 /100 | #14 | Exceptional 2.2% |
| Okinawans | 100.0 /100 | #15 | Exceptional 2.2% |
| Immigrants | Kuwait | 100.0 /100 | #16 | Exceptional 2.2% |
| Immigrants | Saudi Arabia | 100.0 /100 | #17 | Exceptional 2.2% |
| Immigrants | Taiwan | 100.0 /100 | #18 | Exceptional 2.2% |
| Immigrants | Eritrea | 100.0 /100 | #19 | Exceptional 2.2% |
| Tongans | 100.0 /100 | #20 | Exceptional 2.2% |