Immigrants from India vs Salvadoran Vision Disability
COMPARE
Immigrants from India
Salvadoran
Vision Disability
Vision Disability Comparison
Immigrants from India
Salvadorans
1.7%
VISION DISABILITY
100.0/ 100
METRIC RATING
1st/ 347
METRIC RANK
2.2%
VISION DISABILITY
27.4/ 100
METRIC RATING
189th/ 347
METRIC RANK
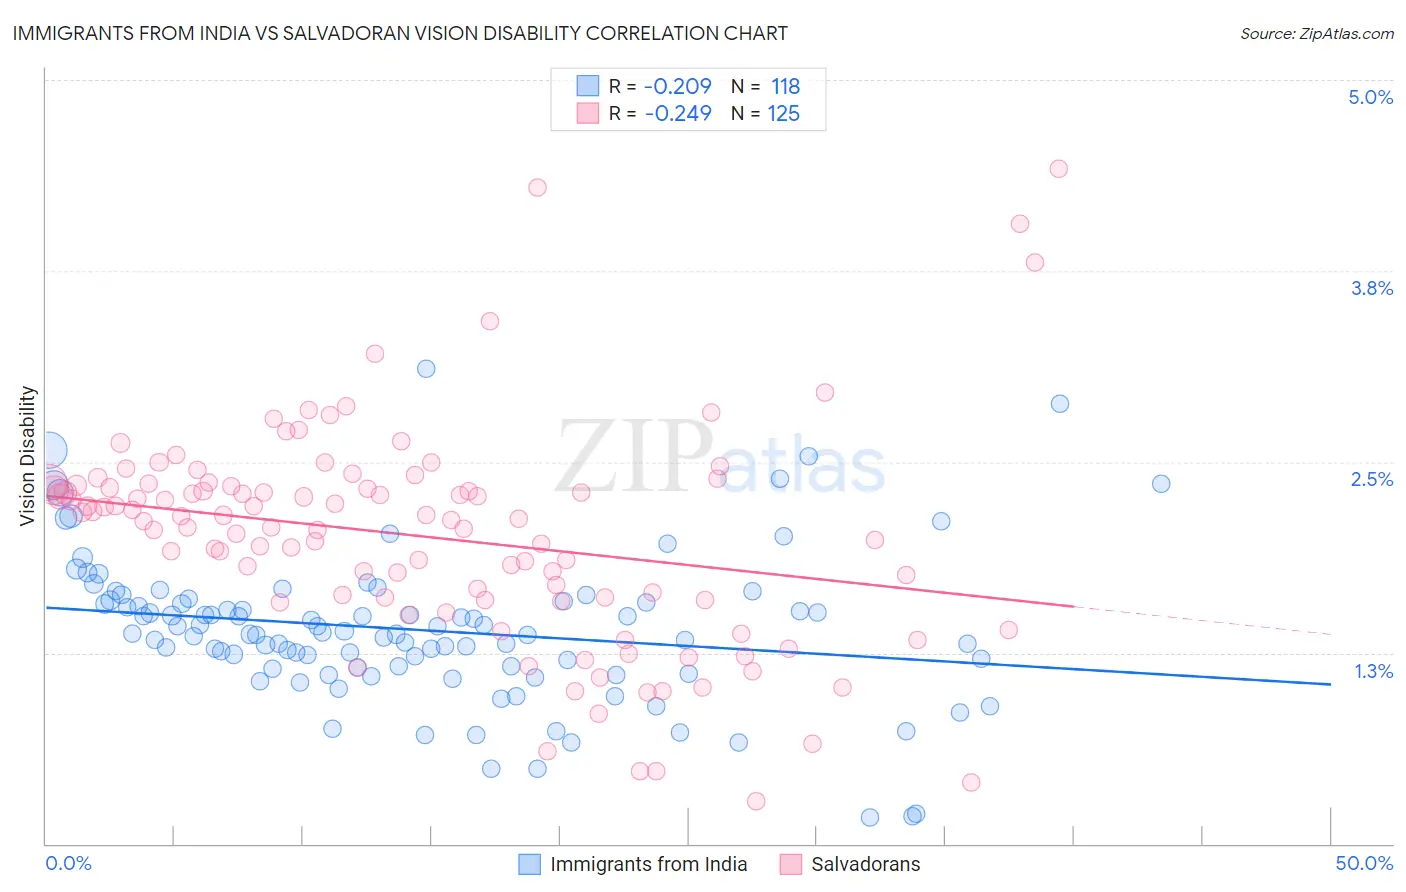
Immigrants from India vs Salvadoran Vision Disability Correlation Chart
The statistical analysis conducted on geographies consisting of 433,750,609 people shows a weak negative correlation between the proportion of Immigrants from India and percentage of population with vision disability in the United States with a correlation coefficient (R) of -0.209 and weighted average of 1.7%. Similarly, the statistical analysis conducted on geographies consisting of 398,695,149 people shows a weak negative correlation between the proportion of Salvadorans and percentage of population with vision disability in the United States with a correlation coefficient (R) of -0.249 and weighted average of 2.2%, a difference of 30.6%.
Vision Disability Correlation Summary
| Measurement | Immigrants from India | Salvadoran |
| Minimum | 0.17% | 0.28% |
| Maximum | 3.1% | 4.4% |
| Range | 2.9% | 4.1% |
| Mean | 1.4% | 2.0% |
| Median | 1.4% | 2.1% |
| Interquartile 25% (IQ1) | 1.2% | 1.6% |
| Interquartile 75% (IQ3) | 1.6% | 2.3% |
| Interquartile Range (IQR) | 0.43% | 0.75% |
| Standard Deviation (Sample) | 0.49% | 0.72% |
| Standard Deviation (Population) | 0.49% | 0.71% |
Similar Demographics by Vision Disability
Demographics Similar to Immigrants from India by Vision Disability
In terms of vision disability, the demographic groups most similar to Immigrants from India are Filipino (1.7%, a difference of 0.050%), Immigrants from Taiwan (1.7%, a difference of 0.71%), Thai (1.7%, a difference of 3.4%), Okinawan (1.8%, a difference of 5.3%), and Immigrants from Iran (1.8%, a difference of 6.0%).
| Demographics | Rating | Rank | Vision Disability |
| Immigrants | India | 100.0 /100 | #1 | Exceptional 1.7% |
| Filipinos | 100.0 /100 | #2 | Exceptional 1.7% |
| Immigrants | Taiwan | 100.0 /100 | #3 | Exceptional 1.7% |
| Thais | 100.0 /100 | #4 | Exceptional 1.7% |
| Okinawans | 100.0 /100 | #5 | Exceptional 1.8% |
| Immigrants | Iran | 100.0 /100 | #6 | Exceptional 1.8% |
| Immigrants | South Central Asia | 100.0 /100 | #7 | Exceptional 1.8% |
| Iranians | 100.0 /100 | #8 | Exceptional 1.8% |
| Immigrants | Singapore | 100.0 /100 | #9 | Exceptional 1.8% |
| Immigrants | Hong Kong | 100.0 /100 | #10 | Exceptional 1.8% |
| Immigrants | Israel | 100.0 /100 | #11 | Exceptional 1.8% |
| Immigrants | Korea | 100.0 /100 | #12 | Exceptional 1.8% |
| Immigrants | Eastern Asia | 100.0 /100 | #13 | Exceptional 1.8% |
| Immigrants | China | 100.0 /100 | #14 | Exceptional 1.8% |
| Immigrants | Bolivia | 100.0 /100 | #15 | Exceptional 1.8% |
Demographics Similar to Salvadorans by Vision Disability
In terms of vision disability, the demographic groups most similar to Salvadorans are Guyanese (2.2%, a difference of 0.11%), Immigrants from Costa Rica (2.2%, a difference of 0.11%), Canadian (2.2%, a difference of 0.13%), European (2.2%, a difference of 0.13%), and British (2.2%, a difference of 0.19%).
| Demographics | Rating | Rank | Vision Disability |
| Costa Ricans | 40.7 /100 | #182 | Average 2.2% |
| Immigrants | Burma/Myanmar | 37.9 /100 | #183 | Fair 2.2% |
| Moroccans | 35.4 /100 | #184 | Fair 2.2% |
| Immigrants | Middle Africa | 33.5 /100 | #185 | Fair 2.2% |
| Native Hawaiians | 33.3 /100 | #186 | Fair 2.2% |
| Immigrants | St. Vincent and the Grenadines | 30.3 /100 | #187 | Fair 2.2% |
| Guyanese | 28.9 /100 | #188 | Fair 2.2% |
| Salvadorans | 27.4 /100 | #189 | Fair 2.2% |
| Immigrants | Costa Rica | 26.1 /100 | #190 | Fair 2.2% |
| Canadians | 25.8 /100 | #191 | Fair 2.2% |
| Europeans | 25.7 /100 | #192 | Fair 2.2% |
| British | 25.1 /100 | #193 | Fair 2.2% |
| Immigrants | Barbados | 24.0 /100 | #194 | Fair 2.2% |
| Immigrants | Immigrants | 23.7 /100 | #195 | Fair 2.2% |
| Immigrants | Grenada | 23.1 /100 | #196 | Fair 2.2% |