Immigrants from Hong Kong vs Guamanian/Chamorro Disability Age 5 to 17
COMPARE
Immigrants from Hong Kong
Guamanian/Chamorro
Disability Age 5 to 17
Disability Age 5 to 17 Comparison
Immigrants from Hong Kong
Guamanians/Chamorros
4.3%
DISABILITY AGE 5 TO 17
100.0/ 100
METRIC RATING
3rd/ 347
METRIC RANK
5.8%
DISABILITY AGE 5 TO 17
5.6/ 100
METRIC RATING
225th/ 347
METRIC RANK
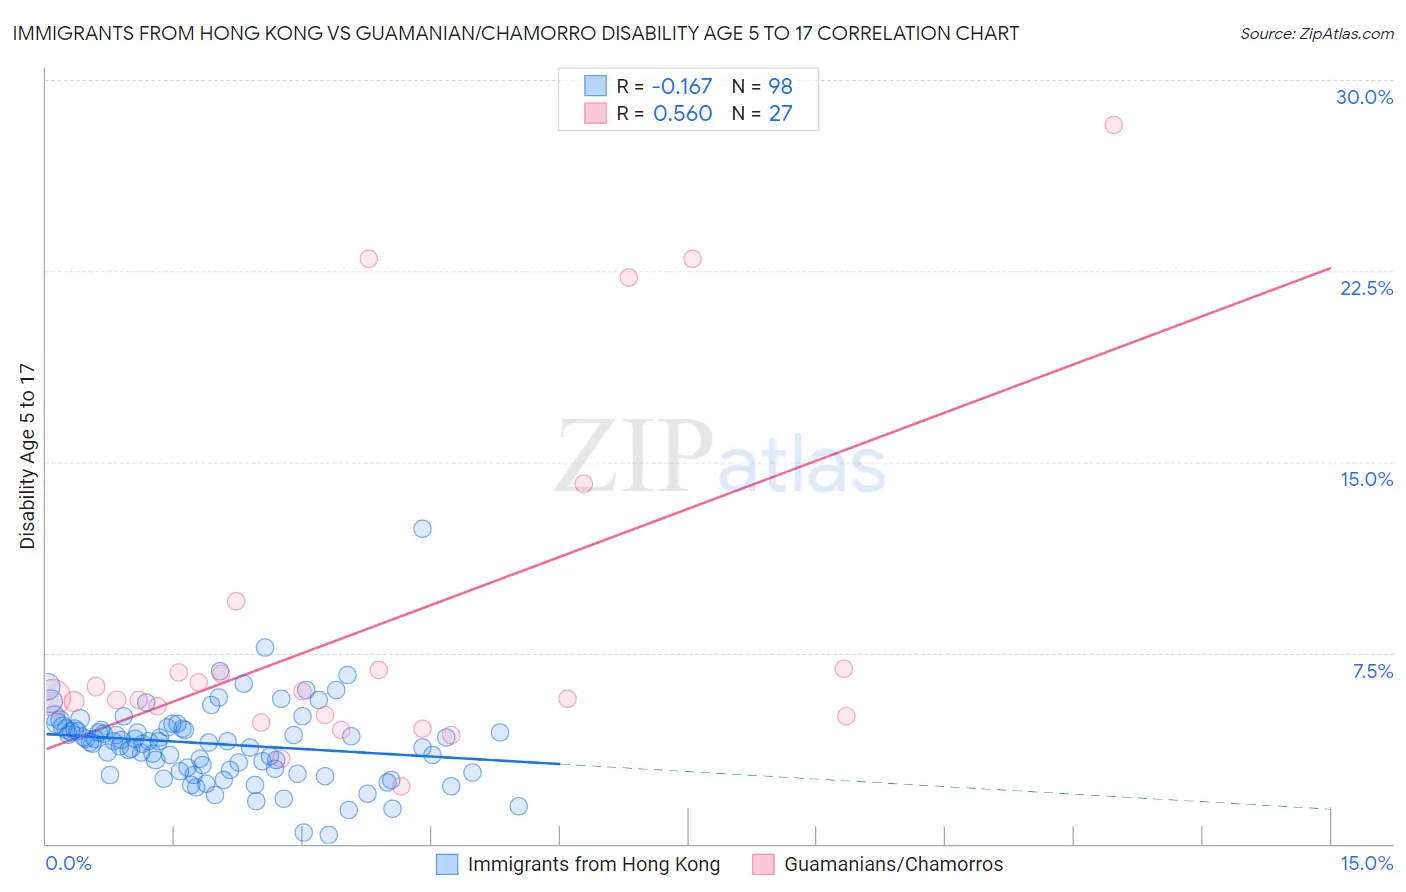
Immigrants from Hong Kong vs Guamanian/Chamorro Disability Age 5 to 17 Correlation Chart
The statistical analysis conducted on geographies consisting of 252,525,907 people shows a poor negative correlation between the proportion of Immigrants from Hong Kong and percentage of population with a disability between the ages 5 and 17 in the United States with a correlation coefficient (R) of -0.167 and weighted average of 4.3%. Similarly, the statistical analysis conducted on geographies consisting of 221,078,318 people shows a substantial positive correlation between the proportion of Guamanians/Chamorros and percentage of population with a disability between the ages 5 and 17 in the United States with a correlation coefficient (R) of 0.560 and weighted average of 5.8%, a difference of 34.9%.
Disability Age 5 to 17 Correlation Summary
| Measurement | Immigrants from Hong Kong | Guamanian/Chamorro |
| Minimum | 0.35% | 2.3% |
| Maximum | 12.4% | 28.2% |
| Range | 12.0% | 26.0% |
| Mean | 3.9% | 8.6% |
| Median | 4.0% | 5.7% |
| Interquartile 25% (IQ1) | 2.9% | 5.0% |
| Interquartile 75% (IQ3) | 4.5% | 6.9% |
| Interquartile Range (IQR) | 1.6% | 1.9% |
| Standard Deviation (Sample) | 1.6% | 7.0% |
| Standard Deviation (Population) | 1.6% | 6.8% |
Similar Demographics by Disability Age 5 to 17
Demographics Similar to Immigrants from Hong Kong by Disability Age 5 to 17
In terms of disability age 5 to 17, the demographic groups most similar to Immigrants from Hong Kong are Filipino (4.3%, a difference of 1.0%), Immigrants from Iran (4.4%, a difference of 1.5%), Immigrants from Taiwan (4.2%, a difference of 2.5%), Immigrants from Israel (4.5%, a difference of 5.0%), and Immigrants from China (4.5%, a difference of 5.3%).
| Demographics | Rating | Rank | Disability Age 5 to 17 |
| Immigrants | Armenia | 100.0 /100 | #1 | Exceptional 4.1% |
| Immigrants | Taiwan | 100.0 /100 | #2 | Exceptional 4.2% |
| Immigrants | Hong Kong | 100.0 /100 | #3 | Exceptional 4.3% |
| Filipinos | 100.0 /100 | #4 | Exceptional 4.3% |
| Immigrants | Iran | 100.0 /100 | #5 | Exceptional 4.4% |
| Immigrants | Israel | 100.0 /100 | #6 | Exceptional 4.5% |
| Immigrants | China | 100.0 /100 | #7 | Exceptional 4.5% |
| Indians (Asian) | 100.0 /100 | #8 | Exceptional 4.6% |
| Immigrants | Eastern Asia | 100.0 /100 | #9 | Exceptional 4.6% |
| Immigrants | India | 100.0 /100 | #10 | Exceptional 4.6% |
| Armenians | 100.0 /100 | #11 | Exceptional 4.6% |
| Iranians | 100.0 /100 | #12 | Exceptional 4.6% |
| Thais | 100.0 /100 | #13 | Exceptional 4.7% |
| Immigrants | Korea | 100.0 /100 | #14 | Exceptional 4.7% |
| Chinese | 100.0 /100 | #15 | Exceptional 4.7% |
Demographics Similar to Guamanians/Chamorros by Disability Age 5 to 17
In terms of disability age 5 to 17, the demographic groups most similar to Guamanians/Chamorros are Mexican (5.8%, a difference of 0.020%), British West Indian (5.8%, a difference of 0.040%), Alsatian (5.8%, a difference of 0.080%), Swiss (5.8%, a difference of 0.12%), and Haitian (5.8%, a difference of 0.20%).
| Demographics | Rating | Rank | Disability Age 5 to 17 |
| Immigrants | Sierra Leone | 7.1 /100 | #218 | Tragic 5.8% |
| Sierra Leoneans | 7.0 /100 | #219 | Tragic 5.8% |
| Belgians | 6.9 /100 | #220 | Tragic 5.8% |
| Lithuanians | 6.7 /100 | #221 | Tragic 5.8% |
| Immigrants | Sudan | 6.7 /100 | #222 | Tragic 5.8% |
| Alsatians | 6.0 /100 | #223 | Tragic 5.8% |
| Mexicans | 5.7 /100 | #224 | Tragic 5.8% |
| Guamanians/Chamorros | 5.6 /100 | #225 | Tragic 5.8% |
| British West Indians | 5.4 /100 | #226 | Tragic 5.8% |
| Swiss | 5.1 /100 | #227 | Tragic 5.8% |
| Haitians | 4.8 /100 | #228 | Tragic 5.8% |
| Bangladeshis | 4.8 /100 | #229 | Tragic 5.8% |
| Ghanaians | 4.7 /100 | #230 | Tragic 5.8% |
| Europeans | 4.5 /100 | #231 | Tragic 5.8% |
| Immigrants | Laos | 3.8 /100 | #232 | Tragic 5.8% |