Aleut vs Yugoslavian Vision Disability
COMPARE
Aleut
Yugoslavian
Vision Disability
Vision Disability Comparison
Aleuts
Yugoslavians
2.6%
VISION DISABILITY
0.0/ 100
METRIC RATING
304th/ 347
METRIC RANK
2.2%
VISION DISABILITY
46.5/ 100
METRIC RATING
176th/ 347
METRIC RANK
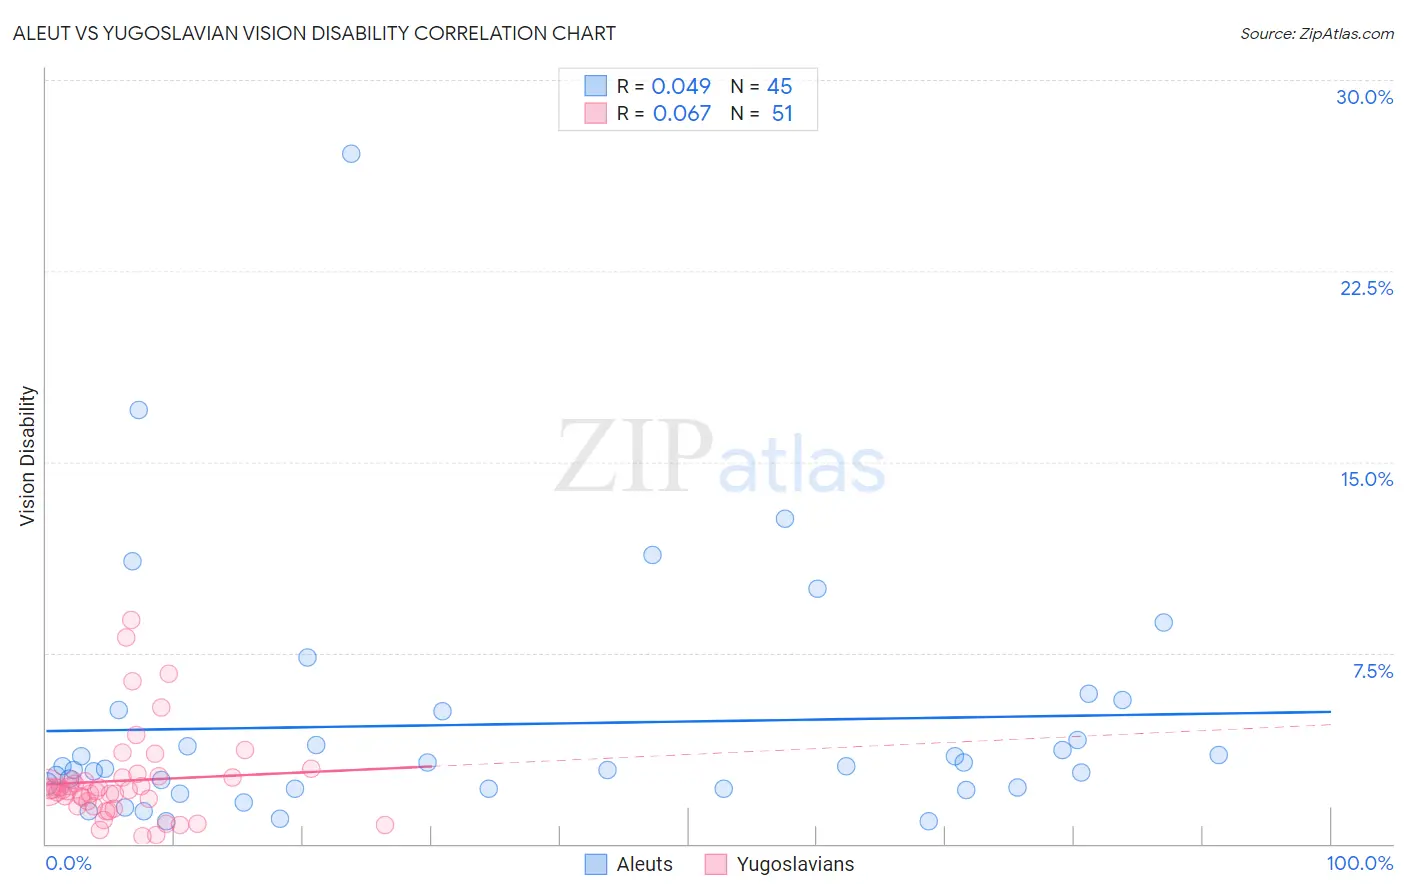
Aleut vs Yugoslavian Vision Disability Correlation Chart
The statistical analysis conducted on geographies consisting of 61,773,801 people shows no correlation between the proportion of Aleuts and percentage of population with vision disability in the United States with a correlation coefficient (R) of 0.049 and weighted average of 2.6%. Similarly, the statistical analysis conducted on geographies consisting of 285,572,549 people shows a slight positive correlation between the proportion of Yugoslavians and percentage of population with vision disability in the United States with a correlation coefficient (R) of 0.067 and weighted average of 2.2%, a difference of 19.1%.
Vision Disability Correlation Summary
| Measurement | Aleut | Yugoslavian |
| Minimum | 0.87% | 0.30% |
| Maximum | 27.1% | 8.8% |
| Range | 26.2% | 8.5% |
| Mean | 4.7% | 2.5% |
| Median | 3.0% | 2.1% |
| Interquartile 25% (IQ1) | 2.2% | 1.5% |
| Interquartile 75% (IQ3) | 5.2% | 2.6% |
| Interquartile Range (IQR) | 3.1% | 1.1% |
| Standard Deviation (Sample) | 4.9% | 1.8% |
| Standard Deviation (Population) | 4.8% | 1.8% |
Similar Demographics by Vision Disability
Demographics Similar to Aleuts by Vision Disability
In terms of vision disability, the demographic groups most similar to Aleuts are Immigrants from Cabo Verde (2.6%, a difference of 0.13%), Hispanic or Latino (2.6%, a difference of 0.30%), Spanish American Indian (2.6%, a difference of 0.36%), Iroquois (2.6%, a difference of 0.91%), and Immigrants from Dominican Republic (2.6%, a difference of 0.94%).
| Demographics | Rating | Rank | Vision Disability |
| Immigrants | Dominica | 0.0 /100 | #297 | Tragic 2.5% |
| Mexicans | 0.0 /100 | #298 | Tragic 2.5% |
| Cree | 0.0 /100 | #299 | Tragic 2.5% |
| Africans | 0.0 /100 | #300 | Tragic 2.5% |
| Menominee | 0.0 /100 | #301 | Tragic 2.5% |
| Spanish American Indians | 0.0 /100 | #302 | Tragic 2.6% |
| Immigrants | Cabo Verde | 0.0 /100 | #303 | Tragic 2.6% |
| Aleuts | 0.0 /100 | #304 | Tragic 2.6% |
| Hispanics or Latinos | 0.0 /100 | #305 | Tragic 2.6% |
| Iroquois | 0.0 /100 | #306 | Tragic 2.6% |
| Immigrants | Dominican Republic | 0.0 /100 | #307 | Tragic 2.6% |
| Arapaho | 0.0 /100 | #308 | Tragic 2.6% |
| Immigrants | Yemen | 0.0 /100 | #309 | Tragic 2.6% |
| Blackfeet | 0.0 /100 | #310 | Tragic 2.6% |
| Dominicans | 0.0 /100 | #311 | Tragic 2.6% |
Demographics Similar to Yugoslavians by Vision Disability
In terms of vision disability, the demographic groups most similar to Yugoslavians are Slavic (2.2%, a difference of 0.040%), Immigrants from Fiji (2.2%, a difference of 0.070%), Immigrants from Oceania (2.2%, a difference of 0.090%), Immigrants from North America (2.2%, a difference of 0.13%), and Northern European (2.2%, a difference of 0.22%).
| Demographics | Rating | Rank | Vision Disability |
| South American Indians | 57.4 /100 | #169 | Average 2.2% |
| Swiss | 55.7 /100 | #170 | Average 2.2% |
| Lebanese | 54.3 /100 | #171 | Average 2.2% |
| Northern Europeans | 50.1 /100 | #172 | Average 2.2% |
| Scandinavians | 50.0 /100 | #173 | Average 2.2% |
| Immigrants | Canada | 50.0 /100 | #174 | Average 2.2% |
| Immigrants | Fiji | 47.6 /100 | #175 | Average 2.2% |
| Yugoslavians | 46.5 /100 | #176 | Average 2.2% |
| Slavs | 46.0 /100 | #177 | Average 2.2% |
| Immigrants | Oceania | 45.1 /100 | #178 | Average 2.2% |
| Immigrants | North America | 44.5 /100 | #179 | Average 2.2% |
| Uruguayans | 42.7 /100 | #180 | Average 2.2% |
| Immigrants | Western Europe | 41.1 /100 | #181 | Average 2.2% |
| Costa Ricans | 40.7 /100 | #182 | Average 2.2% |
| Immigrants | Burma/Myanmar | 37.9 /100 | #183 | Fair 2.2% |