Immigrants from Uzbekistan vs Yugoslavian Vision Disability
COMPARE
Immigrants from Uzbekistan
Yugoslavian
Vision Disability
Vision Disability Comparison
Immigrants from Uzbekistan
Yugoslavians
2.1%
VISION DISABILITY
69.9/ 100
METRIC RATING
158th/ 347
METRIC RANK
2.2%
VISION DISABILITY
46.5/ 100
METRIC RATING
176th/ 347
METRIC RANK
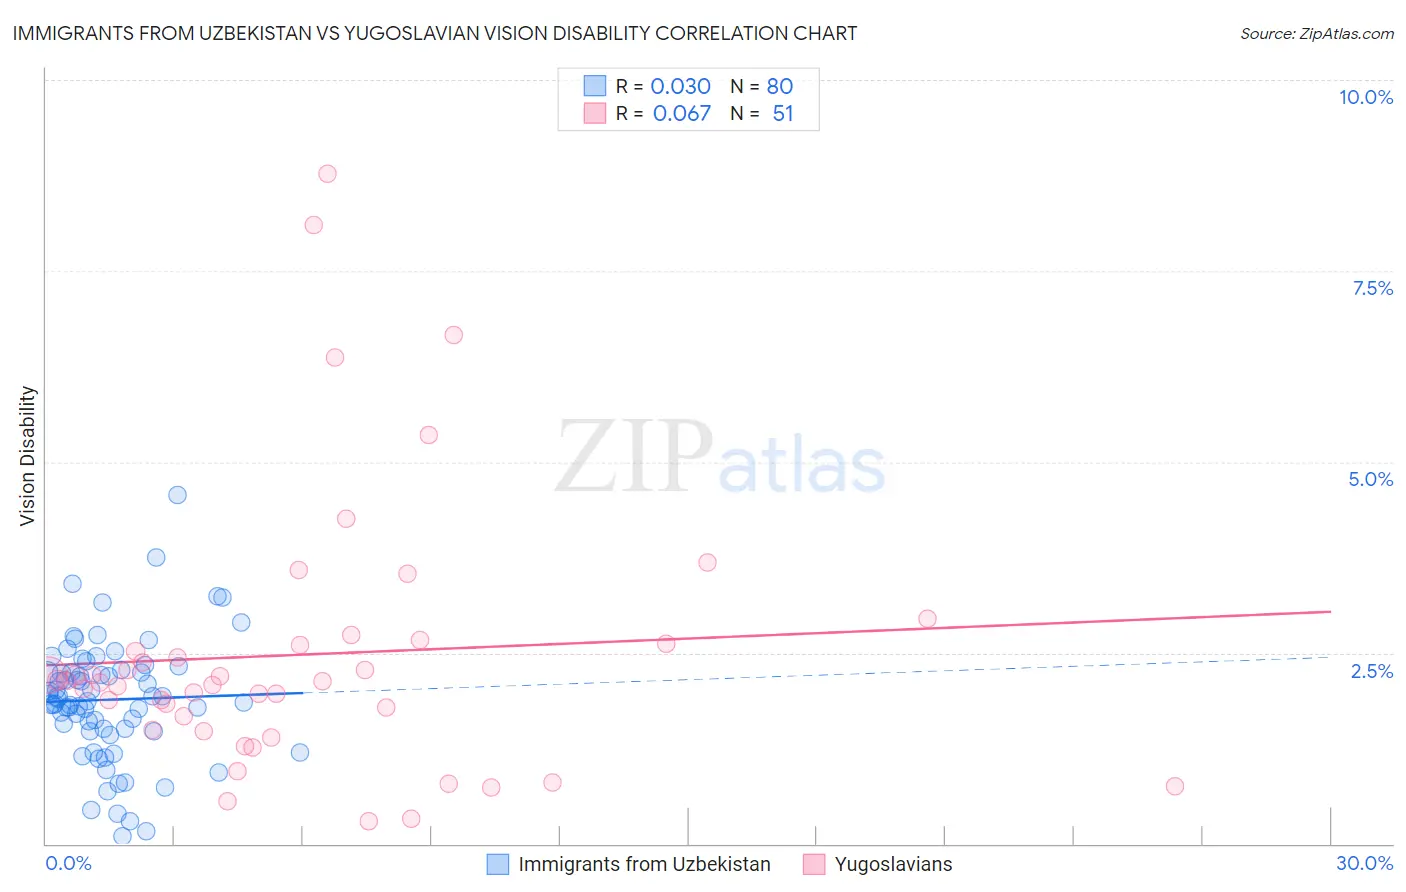
Immigrants from Uzbekistan vs Yugoslavian Vision Disability Correlation Chart
The statistical analysis conducted on geographies consisting of 118,731,595 people shows no correlation between the proportion of Immigrants from Uzbekistan and percentage of population with vision disability in the United States with a correlation coefficient (R) of 0.030 and weighted average of 2.1%. Similarly, the statistical analysis conducted on geographies consisting of 285,572,549 people shows a slight positive correlation between the proportion of Yugoslavians and percentage of population with vision disability in the United States with a correlation coefficient (R) of 0.067 and weighted average of 2.2%, a difference of 1.6%.
Vision Disability Correlation Summary
| Measurement | Immigrants from Uzbekistan | Yugoslavian |
| Minimum | 0.099% | 0.30% |
| Maximum | 4.6% | 8.8% |
| Range | 4.5% | 8.5% |
| Mean | 1.9% | 2.5% |
| Median | 1.9% | 2.1% |
| Interquartile 25% (IQ1) | 1.5% | 1.5% |
| Interquartile 75% (IQ3) | 2.3% | 2.6% |
| Interquartile Range (IQR) | 0.77% | 1.1% |
| Standard Deviation (Sample) | 0.80% | 1.8% |
| Standard Deviation (Population) | 0.79% | 1.8% |
Demographics Similar to Immigrants from Uzbekistan and Yugoslavians by Vision Disability
In terms of vision disability, the demographic groups most similar to Immigrants from Uzbekistan are South African (2.1%, a difference of 0.010%), Serbian (2.1%, a difference of 0.030%), Austrian (2.1%, a difference of 0.070%), Iraqi (2.1%, a difference of 0.16%), and Hungarian (2.1%, a difference of 0.19%). Similarly, the demographic groups most similar to Yugoslavians are Slavic (2.2%, a difference of 0.040%), Immigrants from Fiji (2.2%, a difference of 0.070%), Northern European (2.2%, a difference of 0.22%), Scandinavian (2.2%, a difference of 0.22%), and Immigrants from Canada (2.2%, a difference of 0.22%).
| Demographics | Rating | Rank | Vision Disability |
| Serbians | 70.2 /100 | #157 | Good 2.1% |
| Immigrants | Uzbekistan | 69.9 /100 | #158 | Good 2.1% |
| South Africans | 69.8 /100 | #159 | Good 2.1% |
| Austrians | 69.0 /100 | #160 | Good 2.1% |
| Iraqis | 67.7 /100 | #161 | Good 2.1% |
| Hungarians | 67.4 /100 | #162 | Good 2.1% |
| Icelanders | 66.1 /100 | #163 | Good 2.1% |
| Immigrants | Bangladesh | 65.5 /100 | #164 | Good 2.1% |
| Immigrants | Iraq | 64.8 /100 | #165 | Good 2.1% |
| Immigrants | England | 62.8 /100 | #166 | Good 2.1% |
| Immigrants | Africa | 62.6 /100 | #167 | Good 2.1% |
| Brazilians | 62.2 /100 | #168 | Good 2.1% |
| South American Indians | 57.4 /100 | #169 | Average 2.2% |
| Swiss | 55.7 /100 | #170 | Average 2.2% |
| Lebanese | 54.3 /100 | #171 | Average 2.2% |
| Northern Europeans | 50.1 /100 | #172 | Average 2.2% |
| Scandinavians | 50.0 /100 | #173 | Average 2.2% |
| Immigrants | Canada | 50.0 /100 | #174 | Average 2.2% |
| Immigrants | Fiji | 47.6 /100 | #175 | Average 2.2% |
| Yugoslavians | 46.5 /100 | #176 | Average 2.2% |
| Slavs | 46.0 /100 | #177 | Average 2.2% |