Immigrants from Haiti vs Iraqi Disability Age Over 75
COMPARE
Immigrants from Haiti
Iraqi
Disability Age Over 75
Disability Age Over 75 Comparison
Immigrants from Haiti
Iraqis
47.3%
DISABILITY AGE OVER 75
49.7/ 100
METRIC RATING
175th/ 347
METRIC RANK
48.6%
DISABILITY AGE OVER 75
1.0/ 100
METRIC RATING
249th/ 347
METRIC RANK
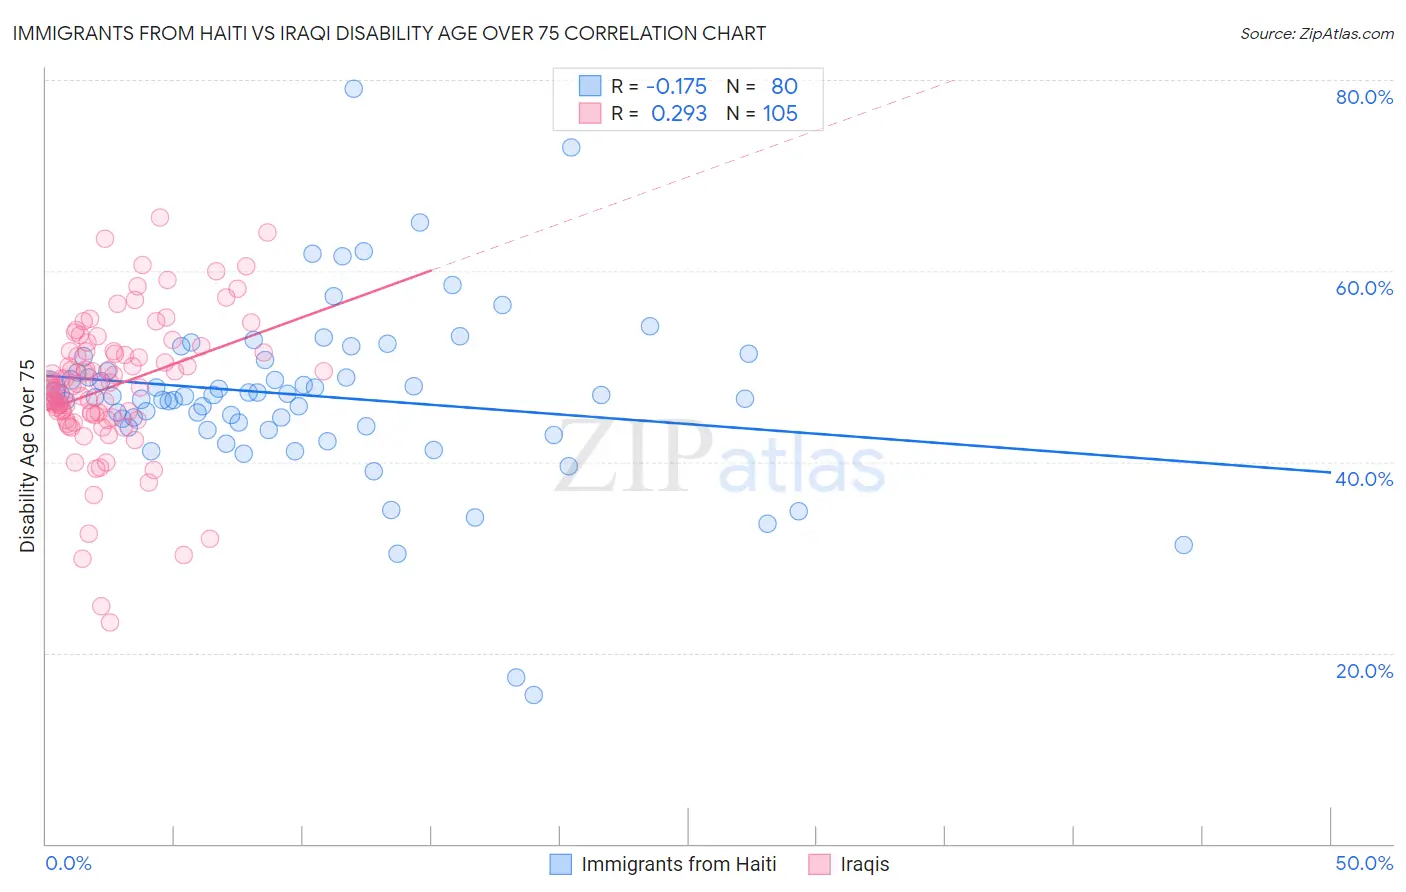
Immigrants from Haiti vs Iraqi Disability Age Over 75 Correlation Chart
The statistical analysis conducted on geographies consisting of 224,903,072 people shows a poor negative correlation between the proportion of Immigrants from Haiti and percentage of population with a disability over the age of 75 in the United States with a correlation coefficient (R) of -0.175 and weighted average of 47.3%. Similarly, the statistical analysis conducted on geographies consisting of 170,579,857 people shows a weak positive correlation between the proportion of Iraqis and percentage of population with a disability over the age of 75 in the United States with a correlation coefficient (R) of 0.293 and weighted average of 48.6%, a difference of 2.6%.
Disability Age Over 75 Correlation Summary
| Measurement | Immigrants from Haiti | Iraqi |
| Minimum | 15.6% | 23.1% |
| Maximum | 79.0% | 65.6% |
| Range | 63.5% | 42.5% |
| Mean | 46.9% | 47.8% |
| Median | 46.9% | 48.0% |
| Interquartile 25% (IQ1) | 43.7% | 44.8% |
| Interquartile 75% (IQ3) | 50.1% | 51.5% |
| Interquartile Range (IQR) | 6.4% | 6.8% |
| Standard Deviation (Sample) | 9.3% | 7.3% |
| Standard Deviation (Population) | 9.2% | 7.3% |
Similar Demographics by Disability Age Over 75
Demographics Similar to Immigrants from Haiti by Disability Age Over 75
In terms of disability age over 75, the demographic groups most similar to Immigrants from Haiti are White/Caucasian (47.3%, a difference of 0.010%), Alsatian (47.3%, a difference of 0.050%), Scotch-Irish (47.3%, a difference of 0.060%), Ecuadorian (47.4%, a difference of 0.070%), and Immigrants from Africa (47.3%, a difference of 0.090%).
| Demographics | Rating | Rank | Disability Age Over 75 |
| Kenyans | 58.8 /100 | #168 | Average 47.2% |
| Celtics | 58.7 /100 | #169 | Average 47.2% |
| German Russians | 56.2 /100 | #170 | Average 47.3% |
| Immigrants | Africa | 53.6 /100 | #171 | Average 47.3% |
| Scotch-Irish | 52.5 /100 | #172 | Average 47.3% |
| Alsatians | 51.9 /100 | #173 | Average 47.3% |
| Whites/Caucasians | 50.0 /100 | #174 | Average 47.3% |
| Immigrants | Haiti | 49.7 /100 | #175 | Average 47.3% |
| Ecuadorians | 46.7 /100 | #176 | Average 47.4% |
| Haitians | 44.6 /100 | #177 | Average 47.4% |
| Cubans | 42.1 /100 | #178 | Average 47.4% |
| Sierra Leoneans | 41.7 /100 | #179 | Average 47.4% |
| Immigrants | Ecuador | 41.7 /100 | #180 | Average 47.4% |
| Immigrants | Kazakhstan | 40.4 /100 | #181 | Average 47.4% |
| Immigrants | Moldova | 39.9 /100 | #182 | Fair 47.4% |
Demographics Similar to Iraqis by Disability Age Over 75
In terms of disability age over 75, the demographic groups most similar to Iraqis are West Indian (48.6%, a difference of 0.080%), Korean (48.6%, a difference of 0.10%), Immigrants from South Eastern Asia (48.7%, a difference of 0.20%), Sri Lankan (48.5%, a difference of 0.21%), and British West Indian (48.7%, a difference of 0.25%).
| Demographics | Rating | Rank | Disability Age Over 75 |
| French American Indians | 2.2 /100 | #242 | Tragic 48.3% |
| Immigrants | Caribbean | 2.1 /100 | #243 | Tragic 48.4% |
| Afghans | 1.8 /100 | #244 | Tragic 48.4% |
| Americans | 1.7 /100 | #245 | Tragic 48.4% |
| Chippewa | 1.6 /100 | #246 | Tragic 48.4% |
| Iroquois | 1.6 /100 | #247 | Tragic 48.4% |
| Sri Lankans | 1.4 /100 | #248 | Tragic 48.5% |
| Iraqis | 1.0 /100 | #249 | Tragic 48.6% |
| West Indians | 0.8 /100 | #250 | Tragic 48.6% |
| Koreans | 0.8 /100 | #251 | Tragic 48.6% |
| Immigrants | South Eastern Asia | 0.7 /100 | #252 | Tragic 48.7% |
| British West Indians | 0.6 /100 | #253 | Tragic 48.7% |
| Immigrants | Vietnam | 0.6 /100 | #254 | Tragic 48.7% |
| Chinese | 0.5 /100 | #255 | Tragic 48.7% |
| Immigrants | Congo | 0.5 /100 | #256 | Tragic 48.7% |