Immigrants from Grenada vs Immigrants from Egypt Kindergarten
COMPARE
Immigrants from Grenada
Immigrants from Egypt
Kindergarten
Kindergarten Comparison
Immigrants from Grenada
Immigrants from Egypt
97.2%
KINDERGARTEN
0.0/ 100
METRIC RATING
295th/ 347
METRIC RANK
97.9%
KINDERGARTEN
22.3/ 100
METRIC RATING
199th/ 347
METRIC RANK
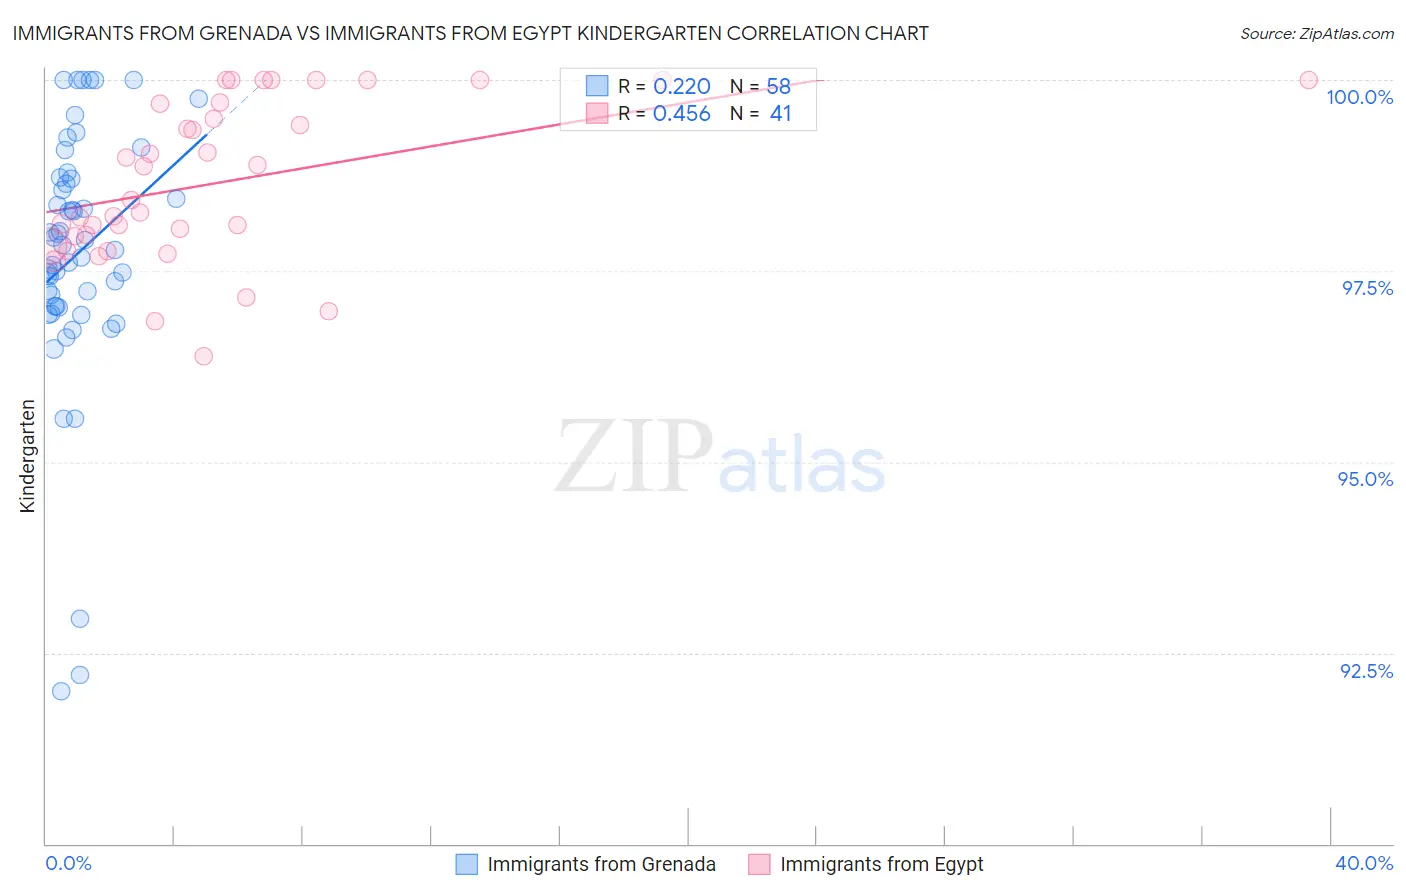
Immigrants from Grenada vs Immigrants from Egypt Kindergarten Correlation Chart
The statistical analysis conducted on geographies consisting of 67,200,336 people shows a weak positive correlation between the proportion of Immigrants from Grenada and percentage of population with at least kindergarten education in the United States with a correlation coefficient (R) of 0.220 and weighted average of 97.2%. Similarly, the statistical analysis conducted on geographies consisting of 245,485,794 people shows a moderate positive correlation between the proportion of Immigrants from Egypt and percentage of population with at least kindergarten education in the United States with a correlation coefficient (R) of 0.456 and weighted average of 97.9%, a difference of 0.66%.
Kindergarten Correlation Summary
| Measurement | Immigrants from Grenada | Immigrants from Egypt |
| Minimum | 92.0% | 96.4% |
| Maximum | 100.0% | 100.0% |
| Range | 8.0% | 3.6% |
| Mean | 97.7% | 98.7% |
| Median | 97.8% | 98.4% |
| Interquartile 25% (IQ1) | 97.0% | 97.9% |
| Interquartile 75% (IQ3) | 98.7% | 99.7% |
| Interquartile Range (IQR) | 1.7% | 1.8% |
| Standard Deviation (Sample) | 1.7% | 1.0% |
| Standard Deviation (Population) | 1.7% | 1.0% |
Similar Demographics by Kindergarten
Demographics Similar to Immigrants from Grenada by Kindergarten
In terms of kindergarten, the demographic groups most similar to Immigrants from Grenada are Immigrants (97.2%, a difference of 0.0%), Immigrants from Eritrea (97.2%, a difference of 0.010%), Malaysian (97.2%, a difference of 0.030%), British West Indian (97.3%, a difference of 0.040%), and Houma (97.3%, a difference of 0.050%).
| Demographics | Rating | Rank | Kindergarten |
| Immigrants | Thailand | 0.0 /100 | #288 | Tragic 97.3% |
| Immigrants | Afghanistan | 0.0 /100 | #289 | Tragic 97.3% |
| Immigrants | St. Vincent and the Grenadines | 0.0 /100 | #290 | Tragic 97.3% |
| Houma | 0.0 /100 | #291 | Tragic 97.3% |
| British West Indians | 0.0 /100 | #292 | Tragic 97.3% |
| Malaysians | 0.0 /100 | #293 | Tragic 97.2% |
| Immigrants | Immigrants | 0.0 /100 | #294 | Tragic 97.2% |
| Immigrants | Grenada | 0.0 /100 | #295 | Tragic 97.2% |
| Immigrants | Eritrea | 0.0 /100 | #296 | Tragic 97.2% |
| Central American Indians | 0.0 /100 | #297 | Tragic 97.2% |
| Immigrants | Dominica | 0.0 /100 | #298 | Tragic 97.1% |
| Immigrants | Cuba | 0.0 /100 | #299 | Tragic 97.1% |
| Haitians | 0.0 /100 | #300 | Tragic 97.1% |
| Immigrants | South Eastern Asia | 0.0 /100 | #301 | Tragic 97.1% |
| Immigrants | Caribbean | 0.0 /100 | #302 | Tragic 97.1% |
Demographics Similar to Immigrants from Egypt by Kindergarten
In terms of kindergarten, the demographic groups most similar to Immigrants from Egypt are Yuman (97.9%, a difference of 0.0%), Immigrants from Kenya (97.9%, a difference of 0.010%), Tohono O'odham (97.9%, a difference of 0.010%), Immigrants from Lebanon (97.9%, a difference of 0.010%), and Guamanian/Chamorro (97.9%, a difference of 0.020%).
| Demographics | Rating | Rank | Kindergarten |
| Blacks/African Americans | 29.9 /100 | #192 | Fair 97.9% |
| Paraguayans | 29.6 /100 | #193 | Fair 97.9% |
| Hawaiians | 29.3 /100 | #194 | Fair 97.9% |
| Mongolians | 28.9 /100 | #195 | Fair 97.9% |
| Guamanians/Chamorros | 26.2 /100 | #196 | Fair 97.9% |
| Immigrants | Kenya | 25.5 /100 | #197 | Fair 97.9% |
| Tohono O'odham | 24.6 /100 | #198 | Fair 97.9% |
| Immigrants | Egypt | 22.3 /100 | #199 | Fair 97.9% |
| Yuman | 21.6 /100 | #200 | Fair 97.9% |
| Immigrants | Lebanon | 20.9 /100 | #201 | Fair 97.9% |
| Immigrants | Ukraine | 19.1 /100 | #202 | Poor 97.8% |
| Immigrants | Uganda | 18.8 /100 | #203 | Poor 97.8% |
| Immigrants | Chile | 18.1 /100 | #204 | Poor 97.8% |
| Immigrants | Southern Europe | 18.0 /100 | #205 | Poor 97.8% |
| Immigrants | Albania | 16.4 /100 | #206 | Poor 97.8% |