Immigrants from Greece vs Yaqui Single Father Poverty
COMPARE
Immigrants from Greece
Yaqui
Single Father Poverty
Single Father Poverty Comparison
Immigrants from Greece
Yaqui
16.7%
SINGLE FATHER POVERTY
8.1/ 100
METRIC RATING
221st/ 347
METRIC RANK
15.6%
SINGLE FATHER POVERTY
98.1/ 100
METRIC RATING
97th/ 347
METRIC RANK
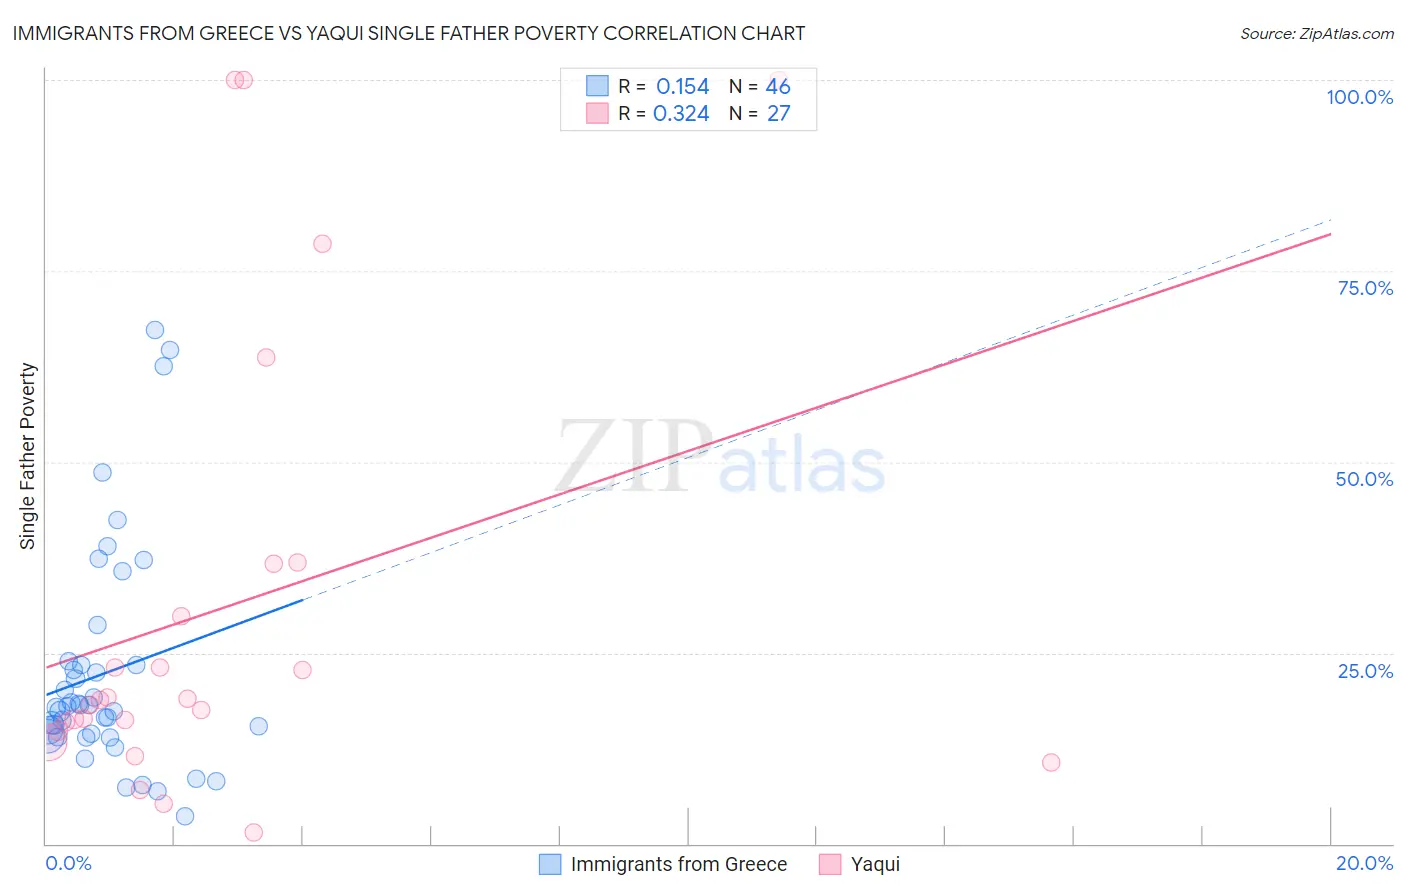
Immigrants from Greece vs Yaqui Single Father Poverty Correlation Chart
The statistical analysis conducted on geographies consisting of 176,789,916 people shows a poor positive correlation between the proportion of Immigrants from Greece and poverty level among single fathers in the United States with a correlation coefficient (R) of 0.154 and weighted average of 16.7%. Similarly, the statistical analysis conducted on geographies consisting of 98,465,633 people shows a mild positive correlation between the proportion of Yaqui and poverty level among single fathers in the United States with a correlation coefficient (R) of 0.324 and weighted average of 15.6%, a difference of 7.4%.
Single Father Poverty Correlation Summary
| Measurement | Immigrants from Greece | Yaqui |
| Minimum | 3.6% | 1.4% |
| Maximum | 67.2% | 100.0% |
| Range | 63.7% | 98.6% |
| Mean | 22.4% | 30.9% |
| Median | 18.0% | 18.8% |
| Interquartile 25% (IQ1) | 14.1% | 14.8% |
| Interquartile 75% (IQ3) | 23.4% | 36.7% |
| Interquartile Range (IQR) | 9.4% | 22.0% |
| Standard Deviation (Sample) | 14.8% | 29.8% |
| Standard Deviation (Population) | 14.7% | 29.2% |
Similar Demographics by Single Father Poverty
Demographics Similar to Immigrants from Greece by Single Father Poverty
In terms of single father poverty, the demographic groups most similar to Immigrants from Greece are Immigrants from Denmark (16.7%, a difference of 0.0%), Immigrants from Ghana (16.7%, a difference of 0.010%), Immigrants from Spain (16.7%, a difference of 0.010%), Immigrants from Uganda (16.7%, a difference of 0.070%), and Cheyenne (16.7%, a difference of 0.17%).
| Demographics | Rating | Rank | Single Father Poverty |
| Spanish | 10.7 /100 | #214 | Poor 16.7% |
| Immigrants | Scotland | 9.6 /100 | #215 | Tragic 16.7% |
| Immigrants | England | 9.5 /100 | #216 | Tragic 16.7% |
| Cheyenne | 9.3 /100 | #217 | Tragic 16.7% |
| Immigrants | Uganda | 8.6 /100 | #218 | Tragic 16.7% |
| Immigrants | Ghana | 8.1 /100 | #219 | Tragic 16.7% |
| Immigrants | Denmark | 8.1 /100 | #220 | Tragic 16.7% |
| Immigrants | Greece | 8.1 /100 | #221 | Tragic 16.7% |
| Immigrants | Spain | 8.0 /100 | #222 | Tragic 16.7% |
| Immigrants | Austria | 7.0 /100 | #223 | Tragic 16.8% |
| Immigrants | Norway | 6.5 /100 | #224 | Tragic 16.8% |
| Menominee | 6.4 /100 | #225 | Tragic 16.8% |
| Hispanics or Latinos | 6.1 /100 | #226 | Tragic 16.8% |
| British | 5.6 /100 | #227 | Tragic 16.8% |
| Belgians | 5.3 /100 | #228 | Tragic 16.8% |
Demographics Similar to Yaqui by Single Father Poverty
In terms of single father poverty, the demographic groups most similar to Yaqui are Immigrants from Belgium (15.6%, a difference of 0.010%), Zimbabwean (15.6%, a difference of 0.010%), Immigrants from Kazakhstan (15.6%, a difference of 0.020%), Immigrants from Uruguay (15.6%, a difference of 0.070%), and Basque (15.5%, a difference of 0.21%).
| Demographics | Rating | Rank | Single Father Poverty |
| Mexican American Indians | 98.7 /100 | #90 | Exceptional 15.5% |
| Immigrants | Romania | 98.6 /100 | #91 | Exceptional 15.5% |
| Immigrants | Serbia | 98.5 /100 | #92 | Exceptional 15.5% |
| Basques | 98.4 /100 | #93 | Exceptional 15.5% |
| Immigrants | Uruguay | 98.2 /100 | #94 | Exceptional 15.6% |
| Immigrants | Kazakhstan | 98.2 /100 | #95 | Exceptional 15.6% |
| Immigrants | Belgium | 98.1 /100 | #96 | Exceptional 15.6% |
| Yaqui | 98.1 /100 | #97 | Exceptional 15.6% |
| Zimbabweans | 98.1 /100 | #98 | Exceptional 15.6% |
| Immigrants | Middle Africa | 97.4 /100 | #99 | Exceptional 15.6% |
| Immigrants | Chile | 96.9 /100 | #100 | Exceptional 15.7% |
| Fijians | 96.8 /100 | #101 | Exceptional 15.7% |
| Chileans | 96.4 /100 | #102 | Exceptional 15.7% |
| South American Indians | 96.2 /100 | #103 | Exceptional 15.7% |
| Australians | 96.1 /100 | #104 | Exceptional 15.7% |