Spanish American Indian vs Immigrants from Scotland Hearing Disability
COMPARE
Spanish American Indian
Immigrants from Scotland
Hearing Disability
Hearing Disability Comparison
Spanish American Indians
Immigrants from Scotland
3.1%
HEARING DISABILITY
24.1/ 100
METRIC RATING
195th/ 347
METRIC RANK
3.3%
HEARING DISABILITY
0.8/ 100
METRIC RATING
245th/ 347
METRIC RANK
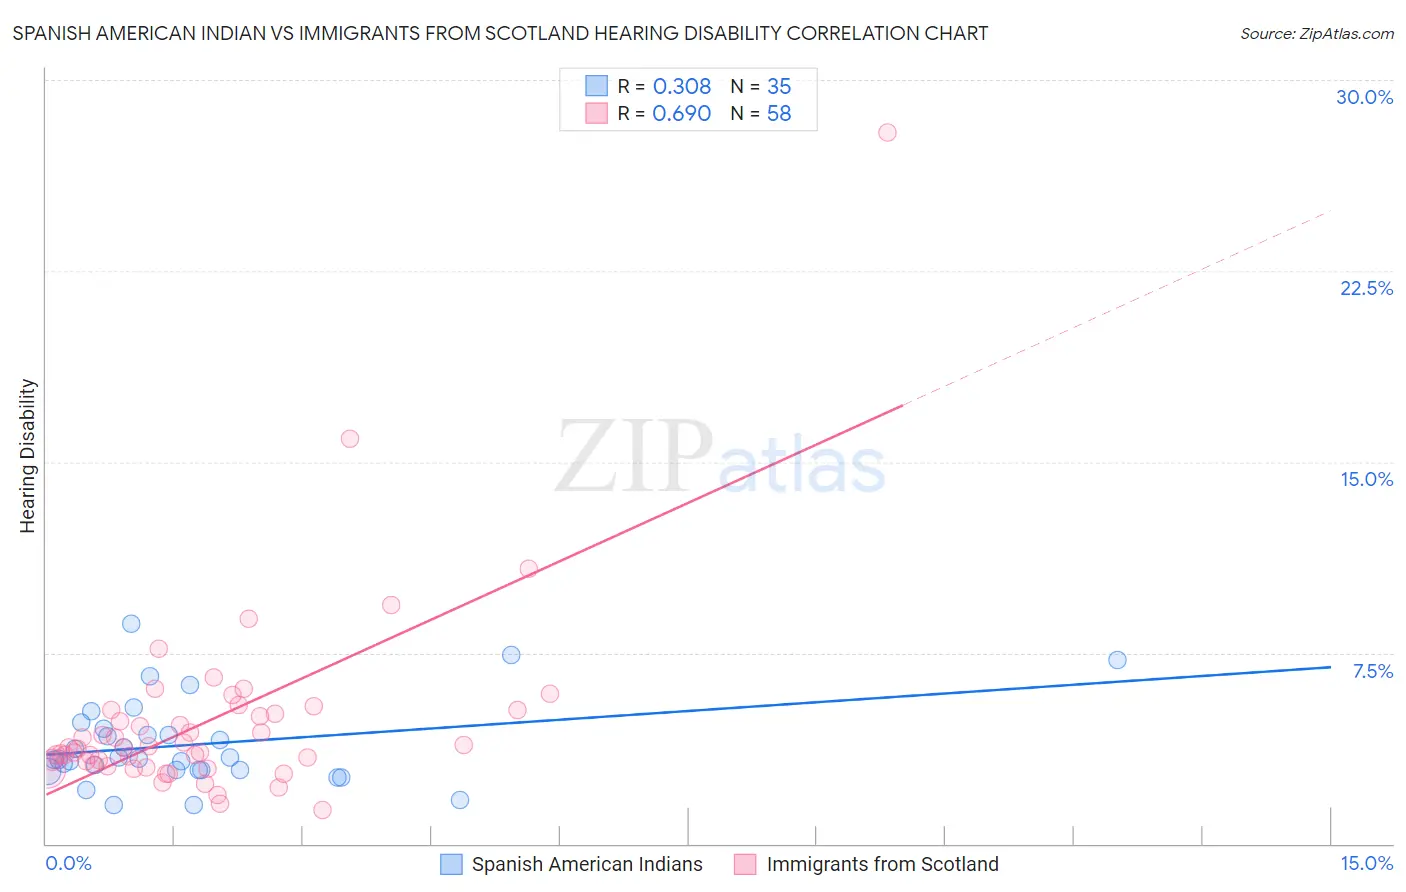
Spanish American Indian vs Immigrants from Scotland Hearing Disability Correlation Chart
The statistical analysis conducted on geographies consisting of 73,148,341 people shows a mild positive correlation between the proportion of Spanish American Indians and percentage of population with hearing disability in the United States with a correlation coefficient (R) of 0.308 and weighted average of 3.1%. Similarly, the statistical analysis conducted on geographies consisting of 196,388,915 people shows a significant positive correlation between the proportion of Immigrants from Scotland and percentage of population with hearing disability in the United States with a correlation coefficient (R) of 0.690 and weighted average of 3.3%, a difference of 8.4%.
Hearing Disability Correlation Summary
| Measurement | Spanish American Indian | Immigrants from Scotland |
| Minimum | 1.5% | 1.3% |
| Maximum | 8.6% | 27.9% |
| Range | 7.1% | 26.6% |
| Mean | 3.9% | 4.8% |
| Median | 3.4% | 3.8% |
| Interquartile 25% (IQ1) | 2.9% | 3.1% |
| Interquartile 75% (IQ3) | 4.5% | 5.2% |
| Interquartile Range (IQR) | 1.6% | 2.1% |
| Standard Deviation (Sample) | 1.7% | 3.9% |
| Standard Deviation (Population) | 1.7% | 3.9% |
Similar Demographics by Hearing Disability
Demographics Similar to Spanish American Indians by Hearing Disability
In terms of hearing disability, the demographic groups most similar to Spanish American Indians are South African (3.1%, a difference of 0.050%), Immigrants from Europe (3.1%, a difference of 0.16%), Macedonian (3.1%, a difference of 0.35%), Korean (3.1%, a difference of 0.42%), and Immigrants from Bosnia and Herzegovina (3.1%, a difference of 0.46%).
| Demographics | Rating | Rank | Hearing Disability |
| Mexican American Indians | 34.7 /100 | #188 | Fair 3.0% |
| Africans | 32.9 /100 | #189 | Fair 3.0% |
| Immigrants | South Africa | 31.1 /100 | #190 | Fair 3.1% |
| Immigrants | Switzerland | 28.8 /100 | #191 | Fair 3.1% |
| Koreans | 27.6 /100 | #192 | Fair 3.1% |
| Macedonians | 27.0 /100 | #193 | Fair 3.1% |
| South Africans | 24.5 /100 | #194 | Fair 3.1% |
| Spanish American Indians | 24.1 /100 | #195 | Fair 3.1% |
| Immigrants | Europe | 22.9 /100 | #196 | Fair 3.1% |
| Immigrants | Bosnia and Herzegovina | 20.6 /100 | #197 | Fair 3.1% |
| Immigrants | Croatia | 20.5 /100 | #198 | Fair 3.1% |
| Syrians | 19.2 /100 | #199 | Poor 3.1% |
| Immigrants | North Macedonia | 19.1 /100 | #200 | Poor 3.1% |
| Iraqis | 19.0 /100 | #201 | Poor 3.1% |
| Immigrants | Thailand | 16.4 /100 | #202 | Poor 3.1% |
Demographics Similar to Immigrants from Scotland by Hearing Disability
In terms of hearing disability, the demographic groups most similar to Immigrants from Scotland are Immigrants from England (3.3%, a difference of 0.28%), Assyrian/Chaldean/Syriac (3.3%, a difference of 0.34%), Immigrants from Western Europe (3.3%, a difference of 0.41%), Lithuanian (3.4%, a difference of 0.48%), and Yugoslavian (3.3%, a difference of 0.58%).
| Demographics | Rating | Rank | Hearing Disability |
| German Russians | 1.8 /100 | #238 | Tragic 3.3% |
| Nepalese | 1.2 /100 | #239 | Tragic 3.3% |
| Immigrants | Netherlands | 1.1 /100 | #240 | Tragic 3.3% |
| Samoans | 1.1 /100 | #241 | Tragic 3.3% |
| Yugoslavians | 1.0 /100 | #242 | Tragic 3.3% |
| Immigrants | Western Europe | 1.0 /100 | #243 | Tragic 3.3% |
| Assyrians/Chaldeans/Syriacs | 0.9 /100 | #244 | Tragic 3.3% |
| Immigrants | Scotland | 0.8 /100 | #245 | Tragic 3.3% |
| Immigrants | England | 0.7 /100 | #246 | Tragic 3.3% |
| Lithuanians | 0.6 /100 | #247 | Tragic 3.4% |
| Austrians | 0.6 /100 | #248 | Tragic 3.4% |
| Italians | 0.4 /100 | #249 | Tragic 3.4% |
| Yuman | 0.4 /100 | #250 | Tragic 3.4% |
| Hungarians | 0.4 /100 | #251 | Tragic 3.4% |
| Croatians | 0.4 /100 | #252 | Tragic 3.4% |