Immigrants from Germany vs Asian Hearing Disability
COMPARE
Immigrants from Germany
Asian
Hearing Disability
Hearing Disability Comparison
Immigrants from Germany
Asians
3.5%
HEARING DISABILITY
0.1/ 100
METRIC RATING
264th/ 347
METRIC RANK
2.7%
HEARING DISABILITY
97.5/ 100
METRIC RATING
76th/ 347
METRIC RANK
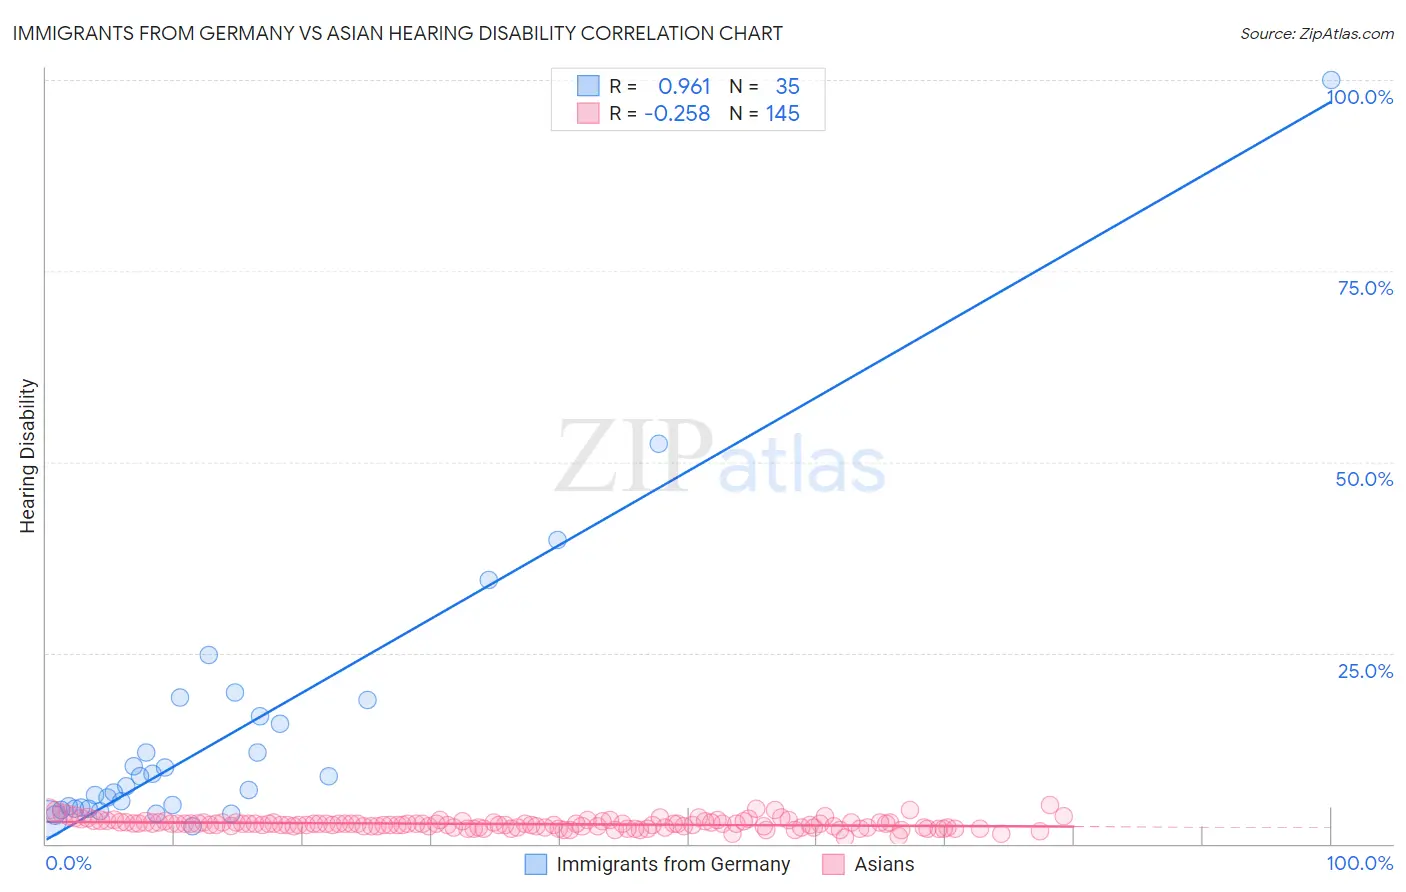
Immigrants from Germany vs Asian Hearing Disability Correlation Chart
The statistical analysis conducted on geographies consisting of 463,741,390 people shows a perfect positive correlation between the proportion of Immigrants from Germany and percentage of population with hearing disability in the United States with a correlation coefficient (R) of 0.961 and weighted average of 3.5%. Similarly, the statistical analysis conducted on geographies consisting of 550,340,322 people shows a weak negative correlation between the proportion of Asians and percentage of population with hearing disability in the United States with a correlation coefficient (R) of -0.258 and weighted average of 2.7%, a difference of 26.9%.
Hearing Disability Correlation Summary
| Measurement | Immigrants from Germany | Asian |
| Minimum | 2.3% | 0.87% |
| Maximum | 100.0% | 5.1% |
| Range | 97.7% | 4.2% |
| Mean | 14.3% | 2.6% |
| Median | 7.5% | 2.6% |
| Interquartile 25% (IQ1) | 4.6% | 2.2% |
| Interquartile 75% (IQ3) | 16.7% | 2.8% |
| Interquartile Range (IQR) | 12.1% | 0.60% |
| Standard Deviation (Sample) | 18.6% | 0.65% |
| Standard Deviation (Population) | 18.3% | 0.65% |
Similar Demographics by Hearing Disability
Demographics Similar to Immigrants from Germany by Hearing Disability
In terms of hearing disability, the demographic groups most similar to Immigrants from Germany are British (3.5%, a difference of 0.020%), Belgian (3.5%, a difference of 0.20%), Immigrants from Canada (3.5%, a difference of 0.22%), Immigrants from North America (3.5%, a difference of 0.26%), and Hawaiian (3.5%, a difference of 0.38%).
| Demographics | Rating | Rank | Hearing Disability |
| Yaqui | 0.2 /100 | #257 | Tragic 3.4% |
| Northern Europeans | 0.2 /100 | #258 | Tragic 3.4% |
| Slovenes | 0.1 /100 | #259 | Tragic 3.5% |
| Portuguese | 0.1 /100 | #260 | Tragic 3.5% |
| Hawaiians | 0.1 /100 | #261 | Tragic 3.5% |
| Immigrants | North America | 0.1 /100 | #262 | Tragic 3.5% |
| Immigrants | Canada | 0.1 /100 | #263 | Tragic 3.5% |
| Immigrants | Germany | 0.1 /100 | #264 | Tragic 3.5% |
| British | 0.1 /100 | #265 | Tragic 3.5% |
| Belgians | 0.1 /100 | #266 | Tragic 3.5% |
| Canadians | 0.1 /100 | #267 | Tragic 3.5% |
| Spaniards | 0.1 /100 | #268 | Tragic 3.5% |
| Ute | 0.1 /100 | #269 | Tragic 3.5% |
| Europeans | 0.1 /100 | #270 | Tragic 3.5% |
| Czechs | 0.1 /100 | #271 | Tragic 3.5% |
Demographics Similar to Asians by Hearing Disability
In terms of hearing disability, the demographic groups most similar to Asians are Immigrants from Saudi Arabia (2.7%, a difference of 0.0%), Immigrants from Malaysia (2.7%, a difference of 0.020%), Argentinean (2.7%, a difference of 0.030%), Immigrants from Korea (2.7%, a difference of 0.030%), and Mongolian (2.7%, a difference of 0.070%).
| Demographics | Rating | Rank | Hearing Disability |
| Nicaraguans | 97.9 /100 | #69 | Exceptional 2.7% |
| Peruvians | 97.7 /100 | #70 | Exceptional 2.7% |
| Central Americans | 97.7 /100 | #71 | Exceptional 2.7% |
| Afghans | 97.6 /100 | #72 | Exceptional 2.7% |
| Argentineans | 97.5 /100 | #73 | Exceptional 2.7% |
| Immigrants | Korea | 97.5 /100 | #74 | Exceptional 2.7% |
| Immigrants | Saudi Arabia | 97.5 /100 | #75 | Exceptional 2.7% |
| Asians | 97.5 /100 | #76 | Exceptional 2.7% |
| Immigrants | Malaysia | 97.5 /100 | #77 | Exceptional 2.7% |
| Mongolians | 97.4 /100 | #78 | Exceptional 2.7% |
| Colombians | 97.4 /100 | #79 | Exceptional 2.7% |
| Immigrants | Asia | 97.2 /100 | #80 | Exceptional 2.7% |
| Immigrants | Uruguay | 97.2 /100 | #81 | Exceptional 2.7% |
| Immigrants | Armenia | 97.2 /100 | #82 | Exceptional 2.7% |
| Immigrants | Cuba | 97.2 /100 | #83 | Exceptional 2.7% |