Panamanian vs Immigrants from Scotland Hearing Disability
COMPARE
Panamanian
Immigrants from Scotland
Hearing Disability
Hearing Disability Comparison
Panamanians
Immigrants from Scotland
3.0%
HEARING DISABILITY
47.0/ 100
METRIC RATING
176th/ 347
METRIC RANK
3.3%
HEARING DISABILITY
0.8/ 100
METRIC RATING
245th/ 347
METRIC RANK
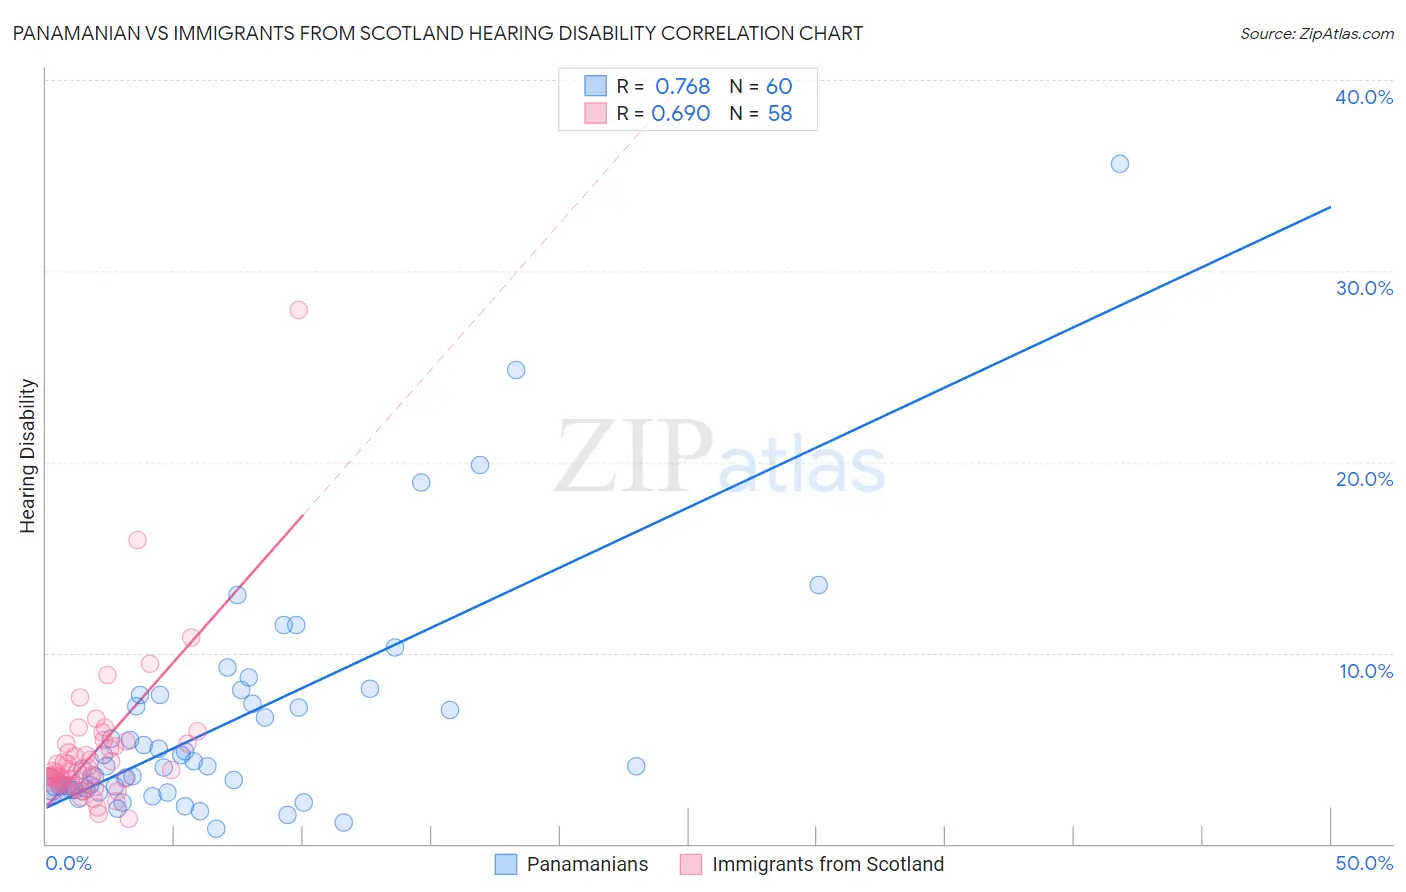
Panamanian vs Immigrants from Scotland Hearing Disability Correlation Chart
The statistical analysis conducted on geographies consisting of 281,114,071 people shows a strong positive correlation between the proportion of Panamanians and percentage of population with hearing disability in the United States with a correlation coefficient (R) of 0.768 and weighted average of 3.0%. Similarly, the statistical analysis conducted on geographies consisting of 196,388,915 people shows a significant positive correlation between the proportion of Immigrants from Scotland and percentage of population with hearing disability in the United States with a correlation coefficient (R) of 0.690 and weighted average of 3.3%, a difference of 11.1%.
Hearing Disability Correlation Summary
| Measurement | Panamanian | Immigrants from Scotland |
| Minimum | 0.76% | 1.3% |
| Maximum | 35.6% | 27.9% |
| Range | 34.9% | 26.6% |
| Mean | 6.2% | 4.8% |
| Median | 4.0% | 3.8% |
| Interquartile 25% (IQ1) | 2.9% | 3.1% |
| Interquartile 75% (IQ3) | 7.6% | 5.2% |
| Interquartile Range (IQR) | 4.7% | 2.1% |
| Standard Deviation (Sample) | 6.1% | 3.9% |
| Standard Deviation (Population) | 6.0% | 3.9% |
Similar Demographics by Hearing Disability
Demographics Similar to Panamanians by Hearing Disability
In terms of hearing disability, the demographic groups most similar to Panamanians are Immigrants from Philippines (3.0%, a difference of 0.060%), Japanese (3.0%, a difference of 0.10%), Immigrants from Romania (3.0%, a difference of 0.14%), Indonesian (3.0%, a difference of 0.28%), and Immigrants from Moldova (3.0%, a difference of 0.37%).
| Demographics | Rating | Rank | Hearing Disability |
| Arabs | 57.6 /100 | #169 | Average 3.0% |
| Immigrants | Cabo Verde | 56.9 /100 | #170 | Average 3.0% |
| Immigrants | Ukraine | 56.6 /100 | #171 | Average 3.0% |
| Armenians | 56.0 /100 | #172 | Average 3.0% |
| Immigrants | Serbia | 51.1 /100 | #173 | Average 3.0% |
| Indonesians | 50.0 /100 | #174 | Average 3.0% |
| Immigrants | Romania | 48.4 /100 | #175 | Average 3.0% |
| Panamanians | 47.0 /100 | #176 | Average 3.0% |
| Immigrants | Philippines | 46.4 /100 | #177 | Average 3.0% |
| Japanese | 46.0 /100 | #178 | Average 3.0% |
| Immigrants | Moldova | 43.1 /100 | #179 | Average 3.0% |
| Immigrants | Sweden | 42.4 /100 | #180 | Average 3.0% |
| Immigrants | Belgium | 41.5 /100 | #181 | Average 3.0% |
| Immigrants | Italy | 41.1 /100 | #182 | Average 3.0% |
| Bulgarians | 39.7 /100 | #183 | Fair 3.0% |
Demographics Similar to Immigrants from Scotland by Hearing Disability
In terms of hearing disability, the demographic groups most similar to Immigrants from Scotland are Immigrants from England (3.3%, a difference of 0.28%), Assyrian/Chaldean/Syriac (3.3%, a difference of 0.34%), Immigrants from Western Europe (3.3%, a difference of 0.41%), Lithuanian (3.4%, a difference of 0.48%), and Yugoslavian (3.3%, a difference of 0.58%).
| Demographics | Rating | Rank | Hearing Disability |
| German Russians | 1.8 /100 | #238 | Tragic 3.3% |
| Nepalese | 1.2 /100 | #239 | Tragic 3.3% |
| Immigrants | Netherlands | 1.1 /100 | #240 | Tragic 3.3% |
| Samoans | 1.1 /100 | #241 | Tragic 3.3% |
| Yugoslavians | 1.0 /100 | #242 | Tragic 3.3% |
| Immigrants | Western Europe | 1.0 /100 | #243 | Tragic 3.3% |
| Assyrians/Chaldeans/Syriacs | 0.9 /100 | #244 | Tragic 3.3% |
| Immigrants | Scotland | 0.8 /100 | #245 | Tragic 3.3% |
| Immigrants | England | 0.7 /100 | #246 | Tragic 3.3% |
| Lithuanians | 0.6 /100 | #247 | Tragic 3.4% |
| Austrians | 0.6 /100 | #248 | Tragic 3.4% |
| Italians | 0.4 /100 | #249 | Tragic 3.4% |
| Yuman | 0.4 /100 | #250 | Tragic 3.4% |
| Hungarians | 0.4 /100 | #251 | Tragic 3.4% |
| Croatians | 0.4 /100 | #252 | Tragic 3.4% |