Immigrants from Germany vs Macedonian Hearing Disability
COMPARE
Immigrants from Germany
Macedonian
Hearing Disability
Hearing Disability Comparison
Immigrants from Germany
Macedonians
3.5%
HEARING DISABILITY
0.1/ 100
METRIC RATING
264th/ 347
METRIC RANK
3.1%
HEARING DISABILITY
27.0/ 100
METRIC RATING
193rd/ 347
METRIC RANK
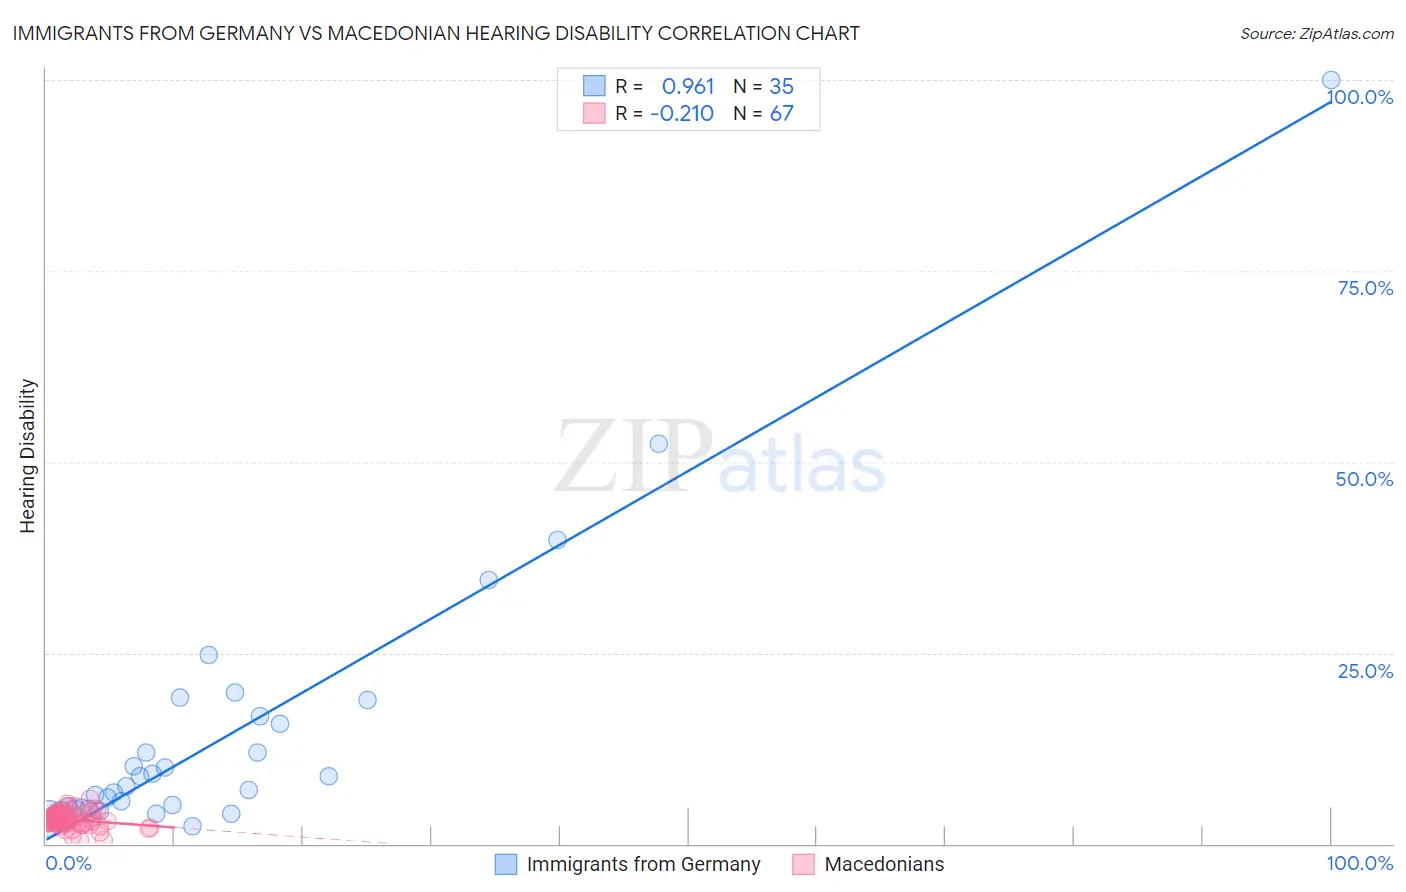
Immigrants from Germany vs Macedonian Hearing Disability Correlation Chart
The statistical analysis conducted on geographies consisting of 463,741,390 people shows a perfect positive correlation between the proportion of Immigrants from Germany and percentage of population with hearing disability in the United States with a correlation coefficient (R) of 0.961 and weighted average of 3.5%. Similarly, the statistical analysis conducted on geographies consisting of 132,651,102 people shows a weak negative correlation between the proportion of Macedonians and percentage of population with hearing disability in the United States with a correlation coefficient (R) of -0.210 and weighted average of 3.1%, a difference of 13.3%.
Hearing Disability Correlation Summary
| Measurement | Immigrants from Germany | Macedonian |
| Minimum | 2.3% | 0.44% |
| Maximum | 100.0% | 5.9% |
| Range | 97.7% | 5.4% |
| Mean | 14.3% | 3.2% |
| Median | 7.5% | 3.1% |
| Interquartile 25% (IQ1) | 4.6% | 2.7% |
| Interquartile 75% (IQ3) | 16.7% | 3.8% |
| Interquartile Range (IQR) | 12.1% | 1.1% |
| Standard Deviation (Sample) | 18.6% | 0.99% |
| Standard Deviation (Population) | 18.3% | 0.99% |
Similar Demographics by Hearing Disability
Demographics Similar to Immigrants from Germany by Hearing Disability
In terms of hearing disability, the demographic groups most similar to Immigrants from Germany are British (3.5%, a difference of 0.020%), Belgian (3.5%, a difference of 0.20%), Immigrants from Canada (3.5%, a difference of 0.22%), Immigrants from North America (3.5%, a difference of 0.26%), and Hawaiian (3.5%, a difference of 0.38%).
| Demographics | Rating | Rank | Hearing Disability |
| Yaqui | 0.2 /100 | #257 | Tragic 3.4% |
| Northern Europeans | 0.2 /100 | #258 | Tragic 3.4% |
| Slovenes | 0.1 /100 | #259 | Tragic 3.5% |
| Portuguese | 0.1 /100 | #260 | Tragic 3.5% |
| Hawaiians | 0.1 /100 | #261 | Tragic 3.5% |
| Immigrants | North America | 0.1 /100 | #262 | Tragic 3.5% |
| Immigrants | Canada | 0.1 /100 | #263 | Tragic 3.5% |
| Immigrants | Germany | 0.1 /100 | #264 | Tragic 3.5% |
| British | 0.1 /100 | #265 | Tragic 3.5% |
| Belgians | 0.1 /100 | #266 | Tragic 3.5% |
| Canadians | 0.1 /100 | #267 | Tragic 3.5% |
| Spaniards | 0.1 /100 | #268 | Tragic 3.5% |
| Ute | 0.1 /100 | #269 | Tragic 3.5% |
| Europeans | 0.1 /100 | #270 | Tragic 3.5% |
| Czechs | 0.1 /100 | #271 | Tragic 3.5% |
Demographics Similar to Macedonians by Hearing Disability
In terms of hearing disability, the demographic groups most similar to Macedonians are Korean (3.1%, a difference of 0.080%), Immigrants from Switzerland (3.1%, a difference of 0.21%), South African (3.1%, a difference of 0.30%), Spanish American Indian (3.1%, a difference of 0.35%), and Immigrants from South Africa (3.1%, a difference of 0.46%).
| Demographics | Rating | Rank | Hearing Disability |
| Immigrants | Mexico | 34.9 /100 | #186 | Fair 3.0% |
| Blacks/African Americans | 34.7 /100 | #187 | Fair 3.0% |
| Mexican American Indians | 34.7 /100 | #188 | Fair 3.0% |
| Africans | 32.9 /100 | #189 | Fair 3.0% |
| Immigrants | South Africa | 31.1 /100 | #190 | Fair 3.1% |
| Immigrants | Switzerland | 28.8 /100 | #191 | Fair 3.1% |
| Koreans | 27.6 /100 | #192 | Fair 3.1% |
| Macedonians | 27.0 /100 | #193 | Fair 3.1% |
| South Africans | 24.5 /100 | #194 | Fair 3.1% |
| Spanish American Indians | 24.1 /100 | #195 | Fair 3.1% |
| Immigrants | Europe | 22.9 /100 | #196 | Fair 3.1% |
| Immigrants | Bosnia and Herzegovina | 20.6 /100 | #197 | Fair 3.1% |
| Immigrants | Croatia | 20.5 /100 | #198 | Fair 3.1% |
| Syrians | 19.2 /100 | #199 | Poor 3.1% |
| Immigrants | North Macedonia | 19.1 /100 | #200 | Poor 3.1% |