Immigrants from Fiji vs Nigerian Seniors Poverty Over the Age of 65
COMPARE
Immigrants from Fiji
Nigerian
Seniors Poverty Over the Age of 65
Seniors Poverty Over the Age of 65 Comparison
Immigrants from Fiji
Nigerians
11.0%
SENIORS POVERTY OVER THE AGE OF 65
42.0/ 100
METRIC RATING
182nd/ 347
METRIC RANK
11.8%
SENIORS POVERTY OVER THE AGE OF 65
3.2/ 100
METRIC RATING
227th/ 347
METRIC RANK
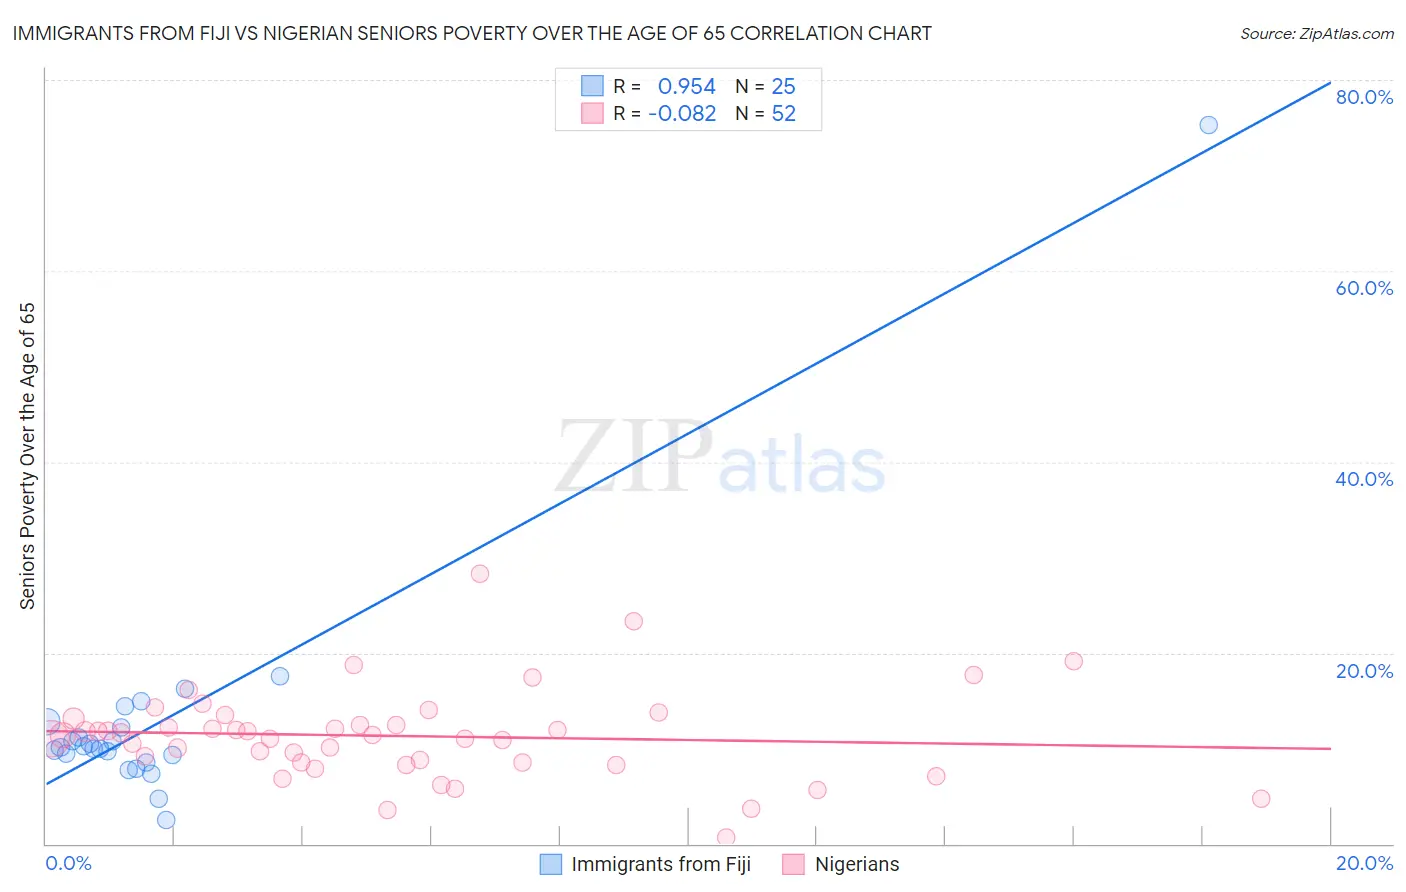
Immigrants from Fiji vs Nigerian Seniors Poverty Over the Age of 65 Correlation Chart
The statistical analysis conducted on geographies consisting of 93,720,826 people shows a perfect positive correlation between the proportion of Immigrants from Fiji and poverty level among seniors over the age of 65 in the United States with a correlation coefficient (R) of 0.954 and weighted average of 11.0%. Similarly, the statistical analysis conducted on geographies consisting of 331,610,759 people shows a slight negative correlation between the proportion of Nigerians and poverty level among seniors over the age of 65 in the United States with a correlation coefficient (R) of -0.082 and weighted average of 11.8%, a difference of 6.8%.
Seniors Poverty Over the Age of 65 Correlation Summary
| Measurement | Immigrants from Fiji | Nigerian |
| Minimum | 2.5% | 0.63% |
| Maximum | 75.3% | 28.3% |
| Range | 72.8% | 27.7% |
| Mean | 12.9% | 11.3% |
| Median | 10.1% | 11.3% |
| Interquartile 25% (IQ1) | 8.9% | 8.5% |
| Interquartile 75% (IQ3) | 12.5% | 12.8% |
| Interquartile Range (IQR) | 3.6% | 4.3% |
| Standard Deviation (Sample) | 13.4% | 4.8% |
| Standard Deviation (Population) | 13.1% | 4.7% |
Similar Demographics by Seniors Poverty Over the Age of 65
Demographics Similar to Immigrants from Fiji by Seniors Poverty Over the Age of 65
In terms of seniors poverty over the age of 65, the demographic groups most similar to Immigrants from Fiji are Immigrants from Kazakhstan (11.0%, a difference of 0.090%), Immigrants from France (11.0%, a difference of 0.10%), Immigrants from Thailand (11.0%, a difference of 0.13%), Immigrants from Eastern Africa (11.0%, a difference of 0.13%), and Immigrants from Northern Africa (11.0%, a difference of 0.23%).
| Demographics | Rating | Rank | Seniors Poverty Over the Age of 65 |
| Creek | 49.6 /100 | #175 | Average 10.9% |
| Immigrants | Malaysia | 47.9 /100 | #176 | Average 11.0% |
| Cherokee | 47.3 /100 | #177 | Average 11.0% |
| German Russians | 46.9 /100 | #178 | Average 11.0% |
| Immigrants | Northern Africa | 44.6 /100 | #179 | Average 11.0% |
| Immigrants | Thailand | 43.5 /100 | #180 | Average 11.0% |
| Immigrants | Eastern Africa | 43.4 /100 | #181 | Average 11.0% |
| Immigrants | Fiji | 42.0 /100 | #182 | Average 11.0% |
| Immigrants | Kazakhstan | 41.0 /100 | #183 | Average 11.0% |
| Immigrants | France | 40.9 /100 | #184 | Average 11.0% |
| Immigrants | Lebanon | 38.2 /100 | #185 | Fair 11.1% |
| Immigrants | Eastern Asia | 37.5 /100 | #186 | Fair 11.1% |
| Immigrants | Middle Africa | 37.4 /100 | #187 | Fair 11.1% |
| Immigrants | Hong Kong | 36.3 /100 | #188 | Fair 11.1% |
| Immigrants | Laos | 35.7 /100 | #189 | Fair 11.1% |
Demographics Similar to Nigerians by Seniors Poverty Over the Age of 65
In terms of seniors poverty over the age of 65, the demographic groups most similar to Nigerians are Liberian (11.8%, a difference of 0.030%), Immigrants from Belarus (11.8%, a difference of 0.060%), Immigrants from Nigeria (11.7%, a difference of 0.16%), Immigrants from Costa Rica (11.8%, a difference of 0.33%), and Immigrants from Congo (11.7%, a difference of 0.39%).
| Demographics | Rating | Rank | Seniors Poverty Over the Age of 65 |
| Peruvians | 4.2 /100 | #220 | Tragic 11.7% |
| Argentineans | 4.1 /100 | #221 | Tragic 11.7% |
| Immigrants | Chile | 3.9 /100 | #222 | Tragic 11.7% |
| Immigrants | Congo | 3.8 /100 | #223 | Tragic 11.7% |
| Immigrants | Nigeria | 3.4 /100 | #224 | Tragic 11.7% |
| Immigrants | Belarus | 3.2 /100 | #225 | Tragic 11.8% |
| Liberians | 3.2 /100 | #226 | Tragic 11.8% |
| Nigerians | 3.2 /100 | #227 | Tragic 11.8% |
| Immigrants | Costa Rica | 2.7 /100 | #228 | Tragic 11.8% |
| Immigrants | Eritrea | 2.6 /100 | #229 | Tragic 11.8% |
| Bermudans | 2.1 /100 | #230 | Tragic 11.9% |
| Cajuns | 2.0 /100 | #231 | Tragic 11.9% |
| Yaqui | 1.9 /100 | #232 | Tragic 11.9% |
| Panamanians | 1.8 /100 | #233 | Tragic 11.9% |
| Iroquois | 1.7 /100 | #234 | Tragic 11.9% |