Immigrants from Europe vs Egyptian Vision Disability
COMPARE
Immigrants from Europe
Egyptian
Vision Disability
Vision Disability Comparison
Immigrants from Europe
Egyptians
2.1%
VISION DISABILITY
96.1/ 100
METRIC RATING
93rd/ 347
METRIC RANK
1.9%
VISION DISABILITY
99.9/ 100
METRIC RATING
29th/ 347
METRIC RANK
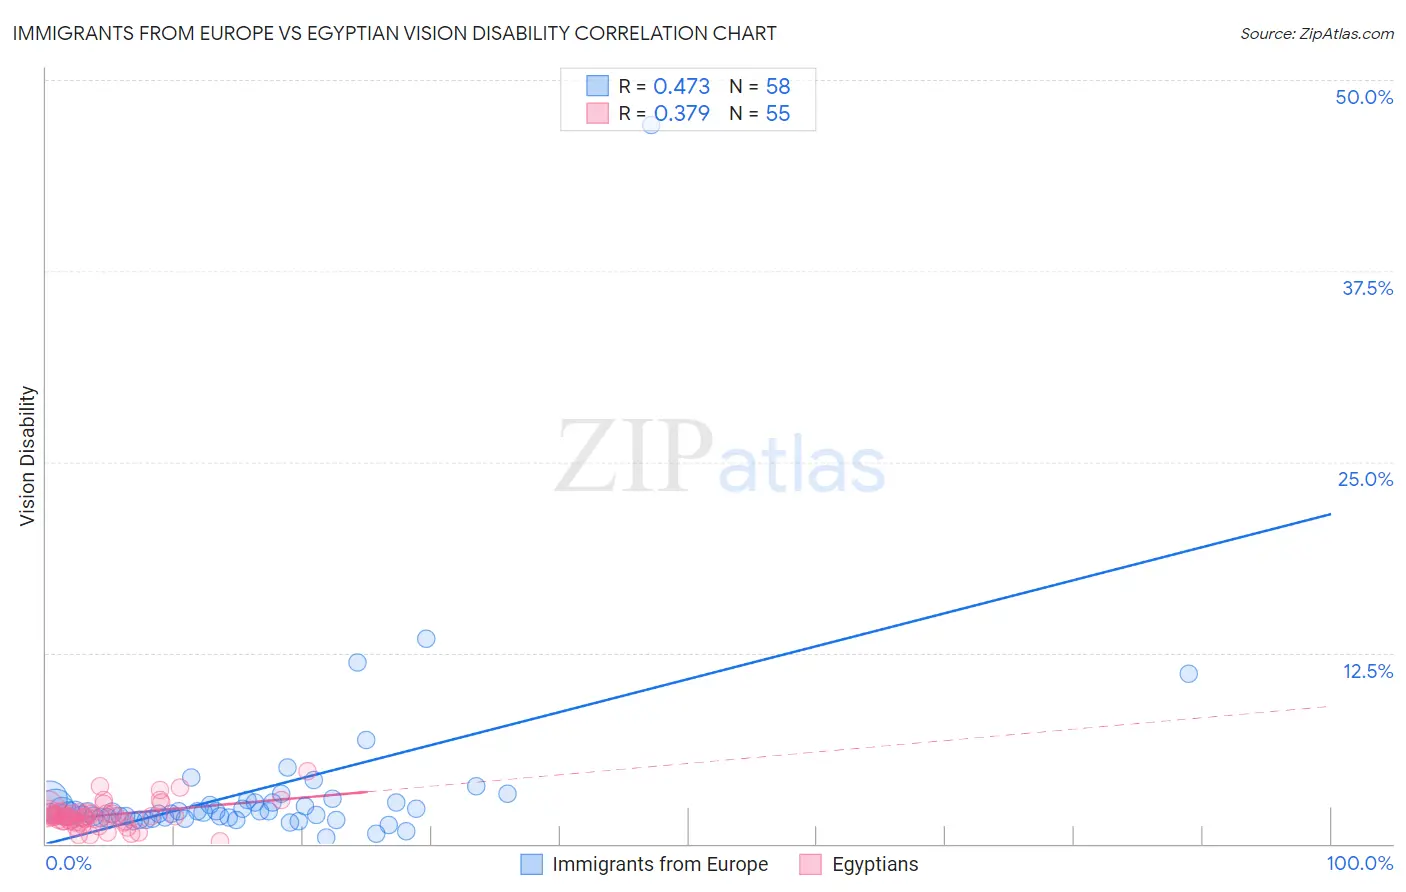
Immigrants from Europe vs Egyptian Vision Disability Correlation Chart
The statistical analysis conducted on geographies consisting of 546,008,895 people shows a moderate positive correlation between the proportion of Immigrants from Europe and percentage of population with vision disability in the United States with a correlation coefficient (R) of 0.473 and weighted average of 2.1%. Similarly, the statistical analysis conducted on geographies consisting of 276,791,971 people shows a mild positive correlation between the proportion of Egyptians and percentage of population with vision disability in the United States with a correlation coefficient (R) of 0.379 and weighted average of 1.9%, a difference of 6.6%.
Vision Disability Correlation Summary
| Measurement | Immigrants from Europe | Egyptian |
| Minimum | 0.41% | 0.14% |
| Maximum | 47.1% | 4.7% |
| Range | 46.7% | 4.6% |
| Mean | 3.5% | 1.9% |
| Median | 2.1% | 1.8% |
| Interquartile 25% (IQ1) | 1.7% | 1.5% |
| Interquartile 75% (IQ3) | 2.7% | 2.0% |
| Interquartile Range (IQR) | 1.0% | 0.54% |
| Standard Deviation (Sample) | 6.3% | 0.83% |
| Standard Deviation (Population) | 6.3% | 0.82% |
Similar Demographics by Vision Disability
Demographics Similar to Immigrants from Europe by Vision Disability
In terms of vision disability, the demographic groups most similar to Immigrants from Europe are Immigrants from Croatia (2.1%, a difference of 0.020%), Immigrants from Syria (2.1%, a difference of 0.050%), Immigrants from Somalia (2.1%, a difference of 0.060%), Australian (2.1%, a difference of 0.090%), and Romanian (2.1%, a difference of 0.15%).
| Demographics | Rating | Rank | Vision Disability |
| Immigrants | Moldova | 97.2 /100 | #86 | Exceptional 2.0% |
| Immigrants | Switzerland | 97.0 /100 | #87 | Exceptional 2.0% |
| Norwegians | 97.0 /100 | #88 | Exceptional 2.0% |
| Immigrants | Eastern Africa | 97.0 /100 | #89 | Exceptional 2.0% |
| Immigrants | Lebanon | 96.7 /100 | #90 | Exceptional 2.1% |
| Immigrants | Somalia | 96.2 /100 | #91 | Exceptional 2.1% |
| Immigrants | Syria | 96.2 /100 | #92 | Exceptional 2.1% |
| Immigrants | Europe | 96.1 /100 | #93 | Exceptional 2.1% |
| Immigrants | Croatia | 96.0 /100 | #94 | Exceptional 2.1% |
| Australians | 95.9 /100 | #95 | Exceptional 2.1% |
| Romanians | 95.7 /100 | #96 | Exceptional 2.1% |
| Immigrants | Afghanistan | 95.6 /100 | #97 | Exceptional 2.1% |
| Immigrants | South Africa | 95.4 /100 | #98 | Exceptional 2.1% |
| Estonians | 95.3 /100 | #99 | Exceptional 2.1% |
| Greeks | 95.1 /100 | #100 | Exceptional 2.1% |
Demographics Similar to Egyptians by Vision Disability
In terms of vision disability, the demographic groups most similar to Egyptians are Immigrants from Nepal (1.9%, a difference of 0.040%), Immigrants from Malaysia (1.9%, a difference of 0.070%), Taiwanese (1.9%, a difference of 0.090%), Mongolian (1.9%, a difference of 0.20%), and Immigrants from Japan (1.9%, a difference of 0.43%).
| Demographics | Rating | Rank | Vision Disability |
| Immigrants | Pakistan | 100.0 /100 | #22 | Exceptional 1.9% |
| Immigrants | Asia | 99.9 /100 | #23 | Exceptional 1.9% |
| Immigrants | Lithuania | 99.9 /100 | #24 | Exceptional 1.9% |
| Bulgarians | 99.9 /100 | #25 | Exceptional 1.9% |
| Immigrants | Japan | 99.9 /100 | #26 | Exceptional 1.9% |
| Taiwanese | 99.9 /100 | #27 | Exceptional 1.9% |
| Immigrants | Malaysia | 99.9 /100 | #28 | Exceptional 1.9% |
| Egyptians | 99.9 /100 | #29 | Exceptional 1.9% |
| Immigrants | Nepal | 99.9 /100 | #30 | Exceptional 1.9% |
| Mongolians | 99.9 /100 | #31 | Exceptional 1.9% |
| Luxembourgers | 99.9 /100 | #32 | Exceptional 1.9% |
| Immigrants | Egypt | 99.9 /100 | #33 | Exceptional 1.9% |
| Immigrants | Turkey | 99.8 /100 | #34 | Exceptional 1.9% |
| Immigrants | Australia | 99.8 /100 | #35 | Exceptional 1.9% |
| Cambodians | 99.8 /100 | #36 | Exceptional 2.0% |