Immigrants from Ethiopia vs Afghan Ambulatory Disability
COMPARE
Immigrants from Ethiopia
Afghan
Ambulatory Disability
Ambulatory Disability Comparison
Immigrants from Ethiopia
Afghans
5.4%
AMBULATORY DISABILITY
100.0/ 100
METRIC RATING
17th/ 347
METRIC RANK
5.5%
AMBULATORY DISABILITY
100.0/ 100
METRIC RATING
35th/ 347
METRIC RANK
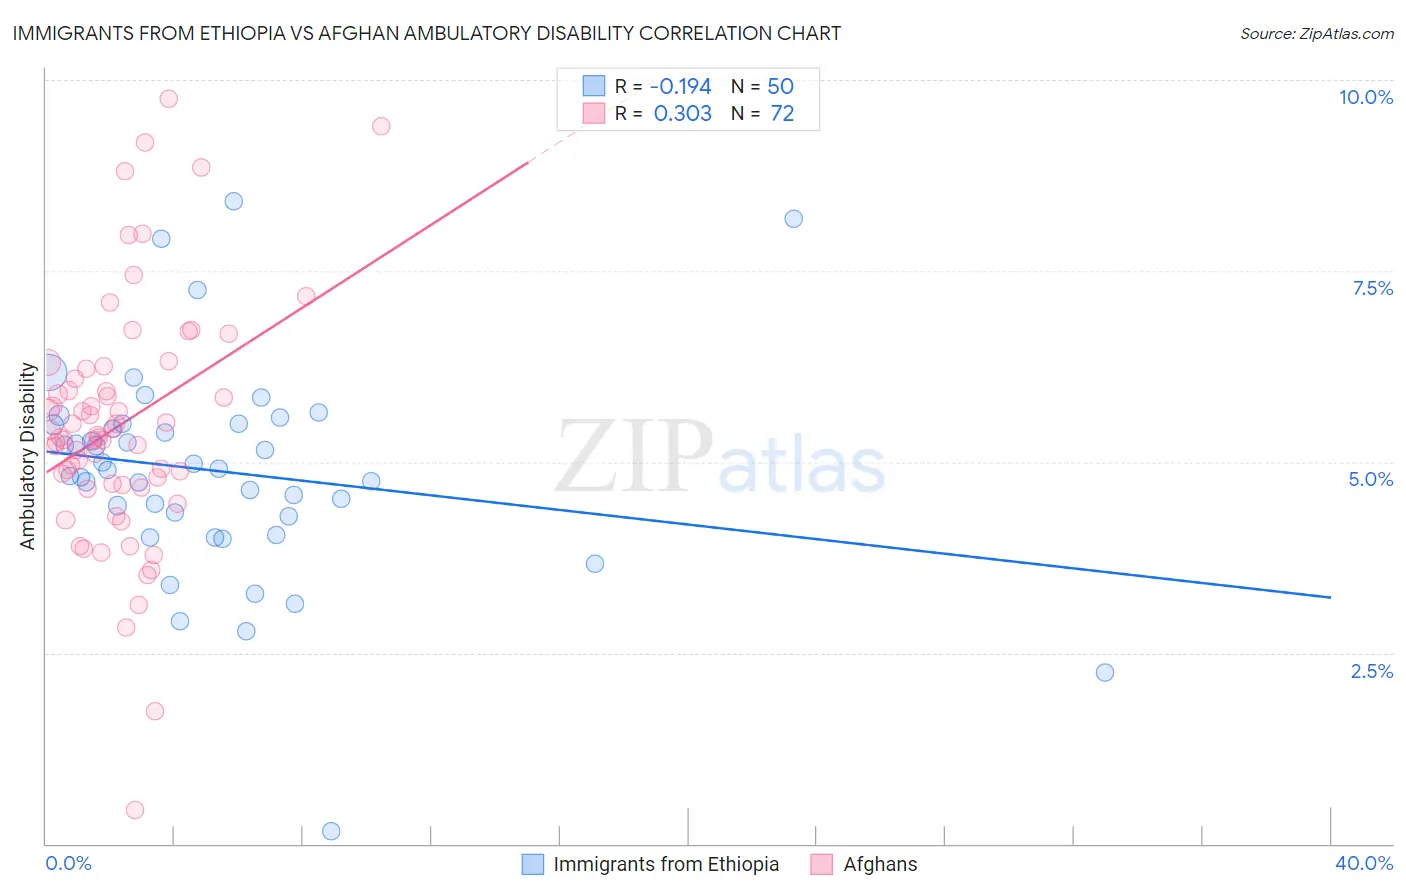
Immigrants from Ethiopia vs Afghan Ambulatory Disability Correlation Chart
The statistical analysis conducted on geographies consisting of 211,510,765 people shows a poor negative correlation between the proportion of Immigrants from Ethiopia and percentage of population with ambulatory disability in the United States with a correlation coefficient (R) of -0.194 and weighted average of 5.4%. Similarly, the statistical analysis conducted on geographies consisting of 148,854,459 people shows a mild positive correlation between the proportion of Afghans and percentage of population with ambulatory disability in the United States with a correlation coefficient (R) of 0.303 and weighted average of 5.5%, a difference of 2.2%.
Ambulatory Disability Correlation Summary
| Measurement | Immigrants from Ethiopia | Afghan |
| Minimum | 0.17% | 0.43% |
| Maximum | 8.4% | 9.8% |
| Range | 8.2% | 9.3% |
| Mean | 4.9% | 5.5% |
| Median | 4.9% | 5.3% |
| Interquartile 25% (IQ1) | 4.3% | 4.7% |
| Interquartile 75% (IQ3) | 5.5% | 6.2% |
| Interquartile Range (IQR) | 1.2% | 1.5% |
| Standard Deviation (Sample) | 1.4% | 1.6% |
| Standard Deviation (Population) | 1.4% | 1.6% |
Demographics Similar to Immigrants from Ethiopia and Afghans by Ambulatory Disability
In terms of ambulatory disability, the demographic groups most similar to Immigrants from Ethiopia are Immigrants from Sri Lanka (5.4%, a difference of 0.010%), Indian (Asian) (5.4%, a difference of 0.11%), Ethiopian (5.4%, a difference of 0.13%), Immigrants from Kuwait (5.4%, a difference of 0.13%), and Immigrants from Hong Kong (5.3%, a difference of 0.34%). Similarly, the demographic groups most similar to Afghans are Immigrants from Asia (5.5%, a difference of 0.040%), Immigrants from Malaysia (5.5%, a difference of 0.070%), Immigrants from Pakistan (5.5%, a difference of 0.20%), Immigrants from Australia (5.5%, a difference of 0.32%), and Immigrants from Venezuela (5.4%, a difference of 0.49%).
| Demographics | Rating | Rank | Ambulatory Disability |
| Immigrants | Hong Kong | 100.0 /100 | #16 | Exceptional 5.3% |
| Immigrants | Ethiopia | 100.0 /100 | #17 | Exceptional 5.4% |
| Immigrants | Sri Lanka | 100.0 /100 | #18 | Exceptional 5.4% |
| Indians (Asian) | 100.0 /100 | #19 | Exceptional 5.4% |
| Ethiopians | 100.0 /100 | #20 | Exceptional 5.4% |
| Immigrants | Kuwait | 100.0 /100 | #21 | Exceptional 5.4% |
| Immigrants | Israel | 100.0 /100 | #22 | Exceptional 5.4% |
| Tongans | 100.0 /100 | #23 | Exceptional 5.4% |
| Immigrants | Saudi Arabia | 100.0 /100 | #24 | Exceptional 5.4% |
| Zimbabweans | 100.0 /100 | #25 | Exceptional 5.4% |
| Immigrants | Nepal | 100.0 /100 | #26 | Exceptional 5.4% |
| Asians | 100.0 /100 | #27 | Exceptional 5.4% |
| Cambodians | 100.0 /100 | #28 | Exceptional 5.4% |
| Immigrants | Iran | 100.0 /100 | #29 | Exceptional 5.4% |
| Immigrants | Turkey | 100.0 /100 | #30 | Exceptional 5.4% |
| Immigrants | Venezuela | 100.0 /100 | #31 | Exceptional 5.4% |
| Immigrants | Australia | 100.0 /100 | #32 | Exceptional 5.5% |
| Immigrants | Pakistan | 100.0 /100 | #33 | Exceptional 5.5% |
| Immigrants | Asia | 100.0 /100 | #34 | Exceptional 5.5% |
| Afghans | 100.0 /100 | #35 | Exceptional 5.5% |
| Immigrants | Malaysia | 100.0 /100 | #36 | Exceptional 5.5% |