Immigrants from Nigeria vs Ottawa Disability
COMPARE
Immigrants from Nigeria
Ottawa
Disability
Disability Comparison
Immigrants from Nigeria
Ottawa
11.3%
DISABILITY
96.0/ 100
METRIC RATING
108th/ 347
METRIC RANK
14.2%
DISABILITY
0.0/ 100
METRIC RATING
327th/ 347
METRIC RANK
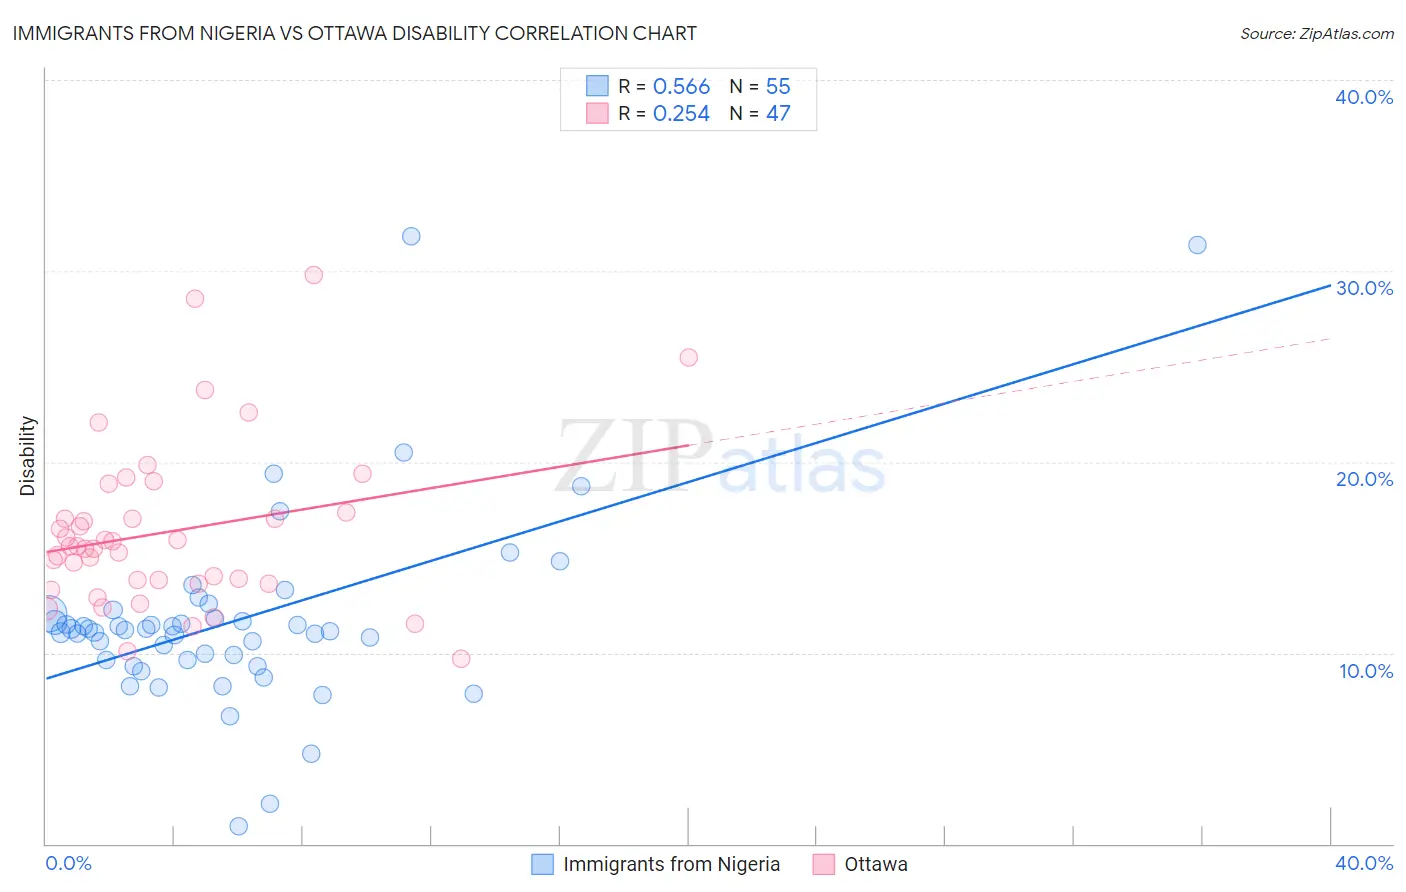
Immigrants from Nigeria vs Ottawa Disability Correlation Chart
The statistical analysis conducted on geographies consisting of 283,478,180 people shows a substantial positive correlation between the proportion of Immigrants from Nigeria and percentage of population with a disability in the United States with a correlation coefficient (R) of 0.566 and weighted average of 11.3%. Similarly, the statistical analysis conducted on geographies consisting of 49,955,365 people shows a weak positive correlation between the proportion of Ottawa and percentage of population with a disability in the United States with a correlation coefficient (R) of 0.254 and weighted average of 14.2%, a difference of 25.4%.
Disability Correlation Summary
| Measurement | Immigrants from Nigeria | Ottawa |
| Minimum | 0.93% | 9.7% |
| Maximum | 31.8% | 29.8% |
| Range | 30.9% | 20.1% |
| Mean | 11.7% | 16.3% |
| Median | 11.2% | 15.6% |
| Interquartile 25% (IQ1) | 9.6% | 13.6% |
| Interquartile 75% (IQ3) | 12.0% | 17.3% |
| Interquartile Range (IQR) | 2.4% | 3.7% |
| Standard Deviation (Sample) | 5.2% | 4.3% |
| Standard Deviation (Population) | 5.1% | 4.3% |
Similar Demographics by Disability
Demographics Similar to Immigrants from Nigeria by Disability
In terms of disability, the demographic groups most similar to Immigrants from Nigeria are Nicaraguan (11.3%, a difference of 0.080%), Immigrants from Uganda (11.3%, a difference of 0.080%), Immigrants from Eastern Europe (11.3%, a difference of 0.10%), Immigrants from Denmark (11.3%, a difference of 0.10%), and Immigrants from Kazakhstan (11.3%, a difference of 0.13%).
| Demographics | Rating | Rank | Disability |
| Immigrants | Nicaragua | 96.8 /100 | #101 | Exceptional 11.3% |
| Immigrants | Eastern Africa | 96.7 /100 | #102 | Exceptional 11.3% |
| Immigrants | Uruguay | 96.4 /100 | #103 | Exceptional 11.3% |
| Immigrants | Immigrants | 96.4 /100 | #104 | Exceptional 11.3% |
| Immigrants | Kazakhstan | 96.4 /100 | #105 | Exceptional 11.3% |
| Immigrants | Eastern Europe | 96.3 /100 | #106 | Exceptional 11.3% |
| Nicaraguans | 96.2 /100 | #107 | Exceptional 11.3% |
| Immigrants | Nigeria | 96.0 /100 | #108 | Exceptional 11.3% |
| Immigrants | Uganda | 95.7 /100 | #109 | Exceptional 11.3% |
| Immigrants | Denmark | 95.6 /100 | #110 | Exceptional 11.3% |
| Immigrants | South Eastern Asia | 95.4 /100 | #111 | Exceptional 11.3% |
| Immigrants | Uzbekistan | 94.9 /100 | #112 | Exceptional 11.3% |
| Guyanese | 94.7 /100 | #113 | Exceptional 11.3% |
| Immigrants | Syria | 94.7 /100 | #114 | Exceptional 11.3% |
| Immigrants | Philippines | 94.6 /100 | #115 | Exceptional 11.3% |
Demographics Similar to Ottawa by Disability
In terms of disability, the demographic groups most similar to Ottawa are Immigrants from the Azores (14.2%, a difference of 0.0%), Osage (14.2%, a difference of 0.020%), Native/Alaskan (14.2%, a difference of 0.060%), Chippewa (14.1%, a difference of 0.10%), and Potawatomi (14.2%, a difference of 0.12%).
| Demographics | Rating | Rank | Disability |
| Apache | 0.0 /100 | #320 | Tragic 13.9% |
| Paiute | 0.0 /100 | #321 | Tragic 13.9% |
| Americans | 0.0 /100 | #322 | Tragic 13.9% |
| Comanche | 0.0 /100 | #323 | Tragic 14.1% |
| Chippewa | 0.0 /100 | #324 | Tragic 14.1% |
| Natives/Alaskans | 0.0 /100 | #325 | Tragic 14.2% |
| Osage | 0.0 /100 | #326 | Tragic 14.2% |
| Ottawa | 0.0 /100 | #327 | Tragic 14.2% |
| Immigrants | Azores | 0.0 /100 | #328 | Tragic 14.2% |
| Potawatomi | 0.0 /100 | #329 | Tragic 14.2% |
| Navajo | 0.0 /100 | #330 | Tragic 14.3% |
| Alaskan Athabascans | 0.0 /100 | #331 | Tragic 14.4% |
| Pueblo | 0.0 /100 | #332 | Tragic 14.4% |
| Cajuns | 0.0 /100 | #333 | Tragic 14.6% |
| Yuman | 0.0 /100 | #334 | Tragic 14.6% |