Immigrants from Cameroon vs Immigrants from South America Male Disability
COMPARE
Immigrants from Cameroon
Immigrants from South America
Male Disability
Male Disability Comparison
Immigrants from Cameroon
Immigrants from South America
10.5%
MALE DISABILITY
99.0/ 100
METRIC RATING
71st/ 347
METRIC RANK
10.4%
MALE DISABILITY
99.6/ 100
METRIC RATING
57th/ 347
METRIC RANK
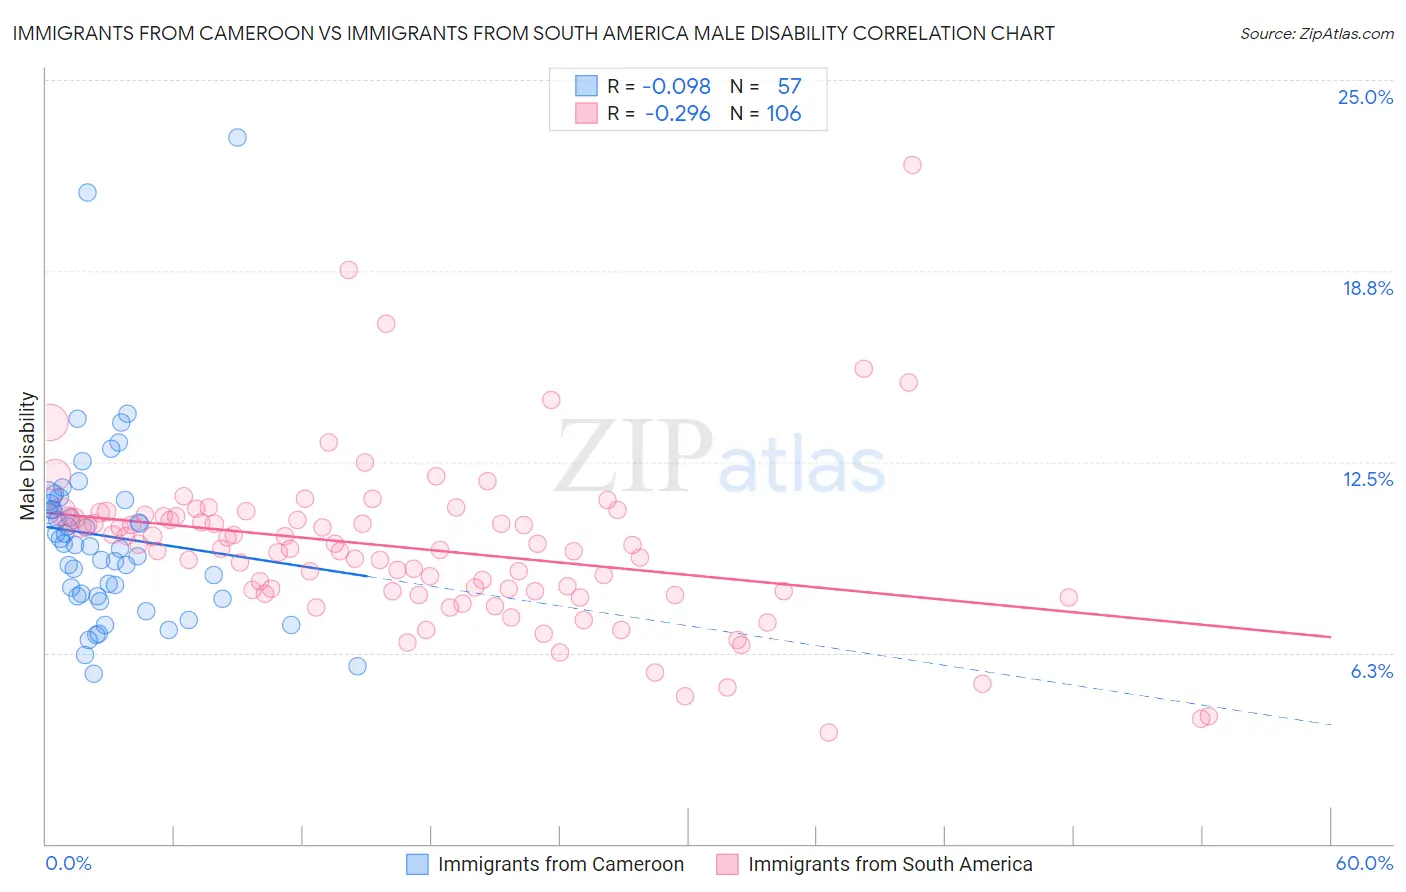
Immigrants from Cameroon vs Immigrants from South America Male Disability Correlation Chart
The statistical analysis conducted on geographies consisting of 130,760,441 people shows a slight negative correlation between the proportion of Immigrants from Cameroon and percentage of males with a disability in the United States with a correlation coefficient (R) of -0.098 and weighted average of 10.5%. Similarly, the statistical analysis conducted on geographies consisting of 486,285,750 people shows a weak negative correlation between the proportion of Immigrants from South America and percentage of males with a disability in the United States with a correlation coefficient (R) of -0.296 and weighted average of 10.4%, a difference of 1.2%.
Male Disability Correlation Summary
| Measurement | Immigrants from Cameroon | Immigrants from South America |
| Minimum | 5.6% | 3.7% |
| Maximum | 23.1% | 22.2% |
| Range | 17.6% | 18.6% |
| Mean | 10.1% | 9.7% |
| Median | 9.8% | 9.7% |
| Interquartile 25% (IQ1) | 8.1% | 8.3% |
| Interquartile 75% (IQ3) | 11.2% | 10.7% |
| Interquartile Range (IQR) | 3.1% | 2.5% |
| Standard Deviation (Sample) | 3.1% | 2.7% |
| Standard Deviation (Population) | 3.1% | 2.7% |
Demographics Similar to Immigrants from Cameroon and Immigrants from South America by Male Disability
In terms of male disability, the demographic groups most similar to Immigrants from Cameroon are Immigrants from Serbia (10.5%, a difference of 0.060%), Immigrants from Lithuania (10.5%, a difference of 0.12%), Immigrants from Bulgaria (10.5%, a difference of 0.15%), Immigrants from Lebanon (10.5%, a difference of 0.26%), and Colombian (10.5%, a difference of 0.29%). Similarly, the demographic groups most similar to Immigrants from South America are Tongan (10.4%, a difference of 0.020%), Immigrants from Eritrea (10.4%, a difference of 0.060%), Immigrants from Japan (10.4%, a difference of 0.070%), Peruvian (10.4%, a difference of 0.080%), and Immigrants from Australia (10.4%, a difference of 0.22%).
| Demographics | Rating | Rank | Male Disability |
| Peruvians | 99.6 /100 | #54 | Exceptional 10.4% |
| Immigrants | Eritrea | 99.6 /100 | #55 | Exceptional 10.4% |
| Tongans | 99.6 /100 | #56 | Exceptional 10.4% |
| Immigrants | South America | 99.6 /100 | #57 | Exceptional 10.4% |
| Immigrants | Japan | 99.5 /100 | #58 | Exceptional 10.4% |
| Immigrants | Australia | 99.5 /100 | #59 | Exceptional 10.4% |
| Immigrants | Colombia | 99.5 /100 | #60 | Exceptional 10.4% |
| Immigrants | Northern Africa | 99.4 /100 | #61 | Exceptional 10.4% |
| Immigrants | Ecuador | 99.3 /100 | #62 | Exceptional 10.4% |
| Immigrants | Belarus | 99.3 /100 | #63 | Exceptional 10.4% |
| Jordanians | 99.3 /100 | #64 | Exceptional 10.5% |
| Immigrants | Grenada | 99.2 /100 | #65 | Exceptional 10.5% |
| Guyanese | 99.2 /100 | #66 | Exceptional 10.5% |
| Immigrants | Afghanistan | 99.2 /100 | #67 | Exceptional 10.5% |
| Colombians | 99.2 /100 | #68 | Exceptional 10.5% |
| Ecuadorians | 99.2 /100 | #69 | Exceptional 10.5% |
| Immigrants | Bulgaria | 99.1 /100 | #70 | Exceptional 10.5% |
| Immigrants | Cameroon | 99.0 /100 | #71 | Exceptional 10.5% |
| Immigrants | Serbia | 99.0 /100 | #72 | Exceptional 10.5% |
| Immigrants | Lithuania | 98.9 /100 | #73 | Exceptional 10.5% |
| Immigrants | Lebanon | 98.8 /100 | #74 | Exceptional 10.5% |