Hopi vs Immigrants from Cambodia Disability Age Over 75
COMPARE
Hopi
Immigrants from Cambodia
Disability Age Over 75
Disability Age Over 75 Comparison
Hopi
Immigrants from Cambodia
52.9%
DISABILITY AGE OVER 75
0.0/ 100
METRIC RATING
331st/ 347
METRIC RANK
50.0%
DISABILITY AGE OVER 75
0.0/ 100
METRIC RATING
294th/ 347
METRIC RANK
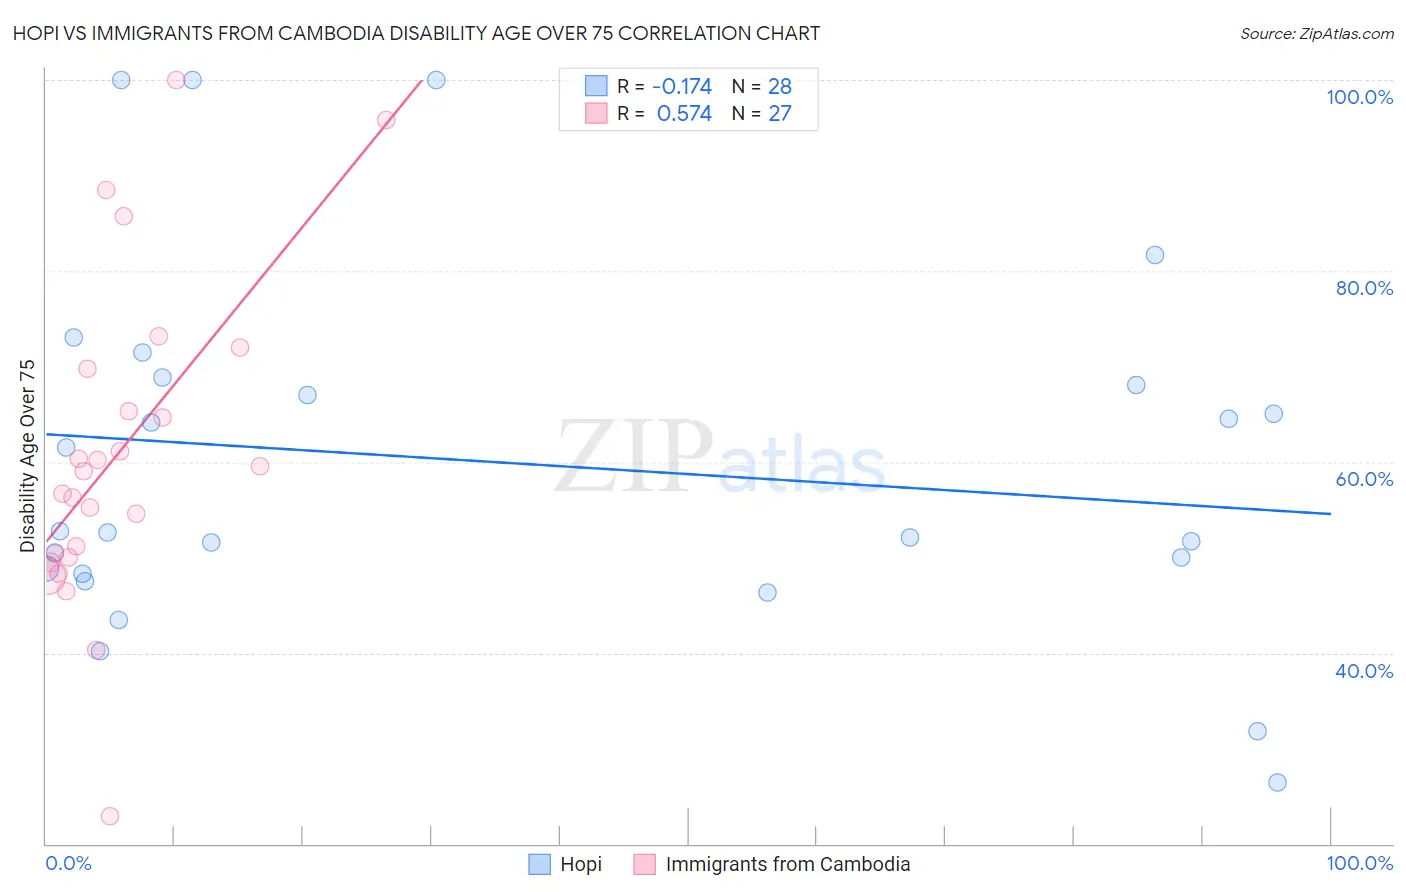
Hopi vs Immigrants from Cambodia Disability Age Over 75 Correlation Chart
The statistical analysis conducted on geographies consisting of 74,658,865 people shows a poor negative correlation between the proportion of Hopi and percentage of population with a disability over the age of 75 in the United States with a correlation coefficient (R) of -0.174 and weighted average of 52.9%. Similarly, the statistical analysis conducted on geographies consisting of 205,096,064 people shows a substantial positive correlation between the proportion of Immigrants from Cambodia and percentage of population with a disability over the age of 75 in the United States with a correlation coefficient (R) of 0.574 and weighted average of 50.0%, a difference of 5.8%.
Disability Age Over 75 Correlation Summary
| Measurement | Hopi | Immigrants from Cambodia |
| Minimum | 26.4% | 22.9% |
| Maximum | 100.0% | 100.0% |
| Range | 73.6% | 77.1% |
| Mean | 60.0% | 60.9% |
| Median | 52.7% | 59.1% |
| Interquartile 25% (IQ1) | 48.5% | 50.0% |
| Interquartile 75% (IQ3) | 68.5% | 69.8% |
| Interquartile Range (IQR) | 20.0% | 19.8% |
| Standard Deviation (Sample) | 18.8% | 17.0% |
| Standard Deviation (Population) | 18.5% | 16.7% |
Similar Demographics by Disability Age Over 75
Demographics Similar to Hopi by Disability Age Over 75
In terms of disability age over 75, the demographic groups most similar to Hopi are Puerto Rican (52.9%, a difference of 0.020%), Alaska Native (52.8%, a difference of 0.19%), Native/Alaskan (53.1%, a difference of 0.29%), Choctaw (52.7%, a difference of 0.41%), and Nepalese (52.6%, a difference of 0.60%).
| Demographics | Rating | Rank | Disability Age Over 75 |
| Menominee | 0.0 /100 | #324 | Tragic 52.3% |
| Immigrants | Cabo Verde | 0.0 /100 | #325 | Tragic 52.4% |
| Ute | 0.0 /100 | #326 | Tragic 52.6% |
| Nepalese | 0.0 /100 | #327 | Tragic 52.6% |
| Choctaw | 0.0 /100 | #328 | Tragic 52.7% |
| Alaska Natives | 0.0 /100 | #329 | Tragic 52.8% |
| Puerto Ricans | 0.0 /100 | #330 | Tragic 52.9% |
| Hopi | 0.0 /100 | #331 | Tragic 52.9% |
| Natives/Alaskans | 0.0 /100 | #332 | Tragic 53.1% |
| Apache | 0.0 /100 | #333 | Tragic 53.6% |
| Alaskan Athabascans | 0.0 /100 | #334 | Tragic 54.0% |
| Kiowa | 0.0 /100 | #335 | Tragic 54.2% |
| Immigrants | Armenia | 0.0 /100 | #336 | Tragic 54.3% |
| Yuman | 0.0 /100 | #337 | Tragic 54.4% |
| Colville | 0.0 /100 | #338 | Tragic 55.4% |
Demographics Similar to Immigrants from Cambodia by Disability Age Over 75
In terms of disability age over 75, the demographic groups most similar to Immigrants from Cambodia are Spanish American (50.0%, a difference of 0.040%), Mexican American Indian (50.0%, a difference of 0.080%), Armenian (50.0%, a difference of 0.10%), Spanish American Indian (49.9%, a difference of 0.12%), and Marshallese (50.1%, a difference of 0.16%).
| Demographics | Rating | Rank | Disability Age Over 75 |
| Sioux | 0.0 /100 | #287 | Tragic 49.7% |
| Yaqui | 0.0 /100 | #288 | Tragic 49.8% |
| Osage | 0.0 /100 | #289 | Tragic 49.8% |
| Puget Sound Salish | 0.0 /100 | #290 | Tragic 49.8% |
| Arapaho | 0.0 /100 | #291 | Tragic 49.8% |
| Shoshone | 0.0 /100 | #292 | Tragic 49.9% |
| Spanish American Indians | 0.0 /100 | #293 | Tragic 49.9% |
| Immigrants | Cambodia | 0.0 /100 | #294 | Tragic 50.0% |
| Spanish Americans | 0.0 /100 | #295 | Tragic 50.0% |
| Mexican American Indians | 0.0 /100 | #296 | Tragic 50.0% |
| Armenians | 0.0 /100 | #297 | Tragic 50.0% |
| Marshallese | 0.0 /100 | #298 | Tragic 50.1% |
| Immigrants | Micronesia | 0.0 /100 | #299 | Tragic 50.1% |
| Cape Verdeans | 0.0 /100 | #300 | Tragic 50.1% |
| Dominicans | 0.0 /100 | #301 | Tragic 50.2% |