Immigrants from Ecuador vs Cypriot Disability Age Under 5
COMPARE
Immigrants from Ecuador
Cypriot
Disability Age Under 5
Disability Age Under 5 Comparison
Immigrants from Ecuador
Cypriots
1.1%
DISABILITY AGE UNDER 5
98.6/ 100
METRIC RATING
70th/ 347
METRIC RANK
1.3%
DISABILITY AGE UNDER 5
14.9/ 100
METRIC RATING
217th/ 347
METRIC RANK
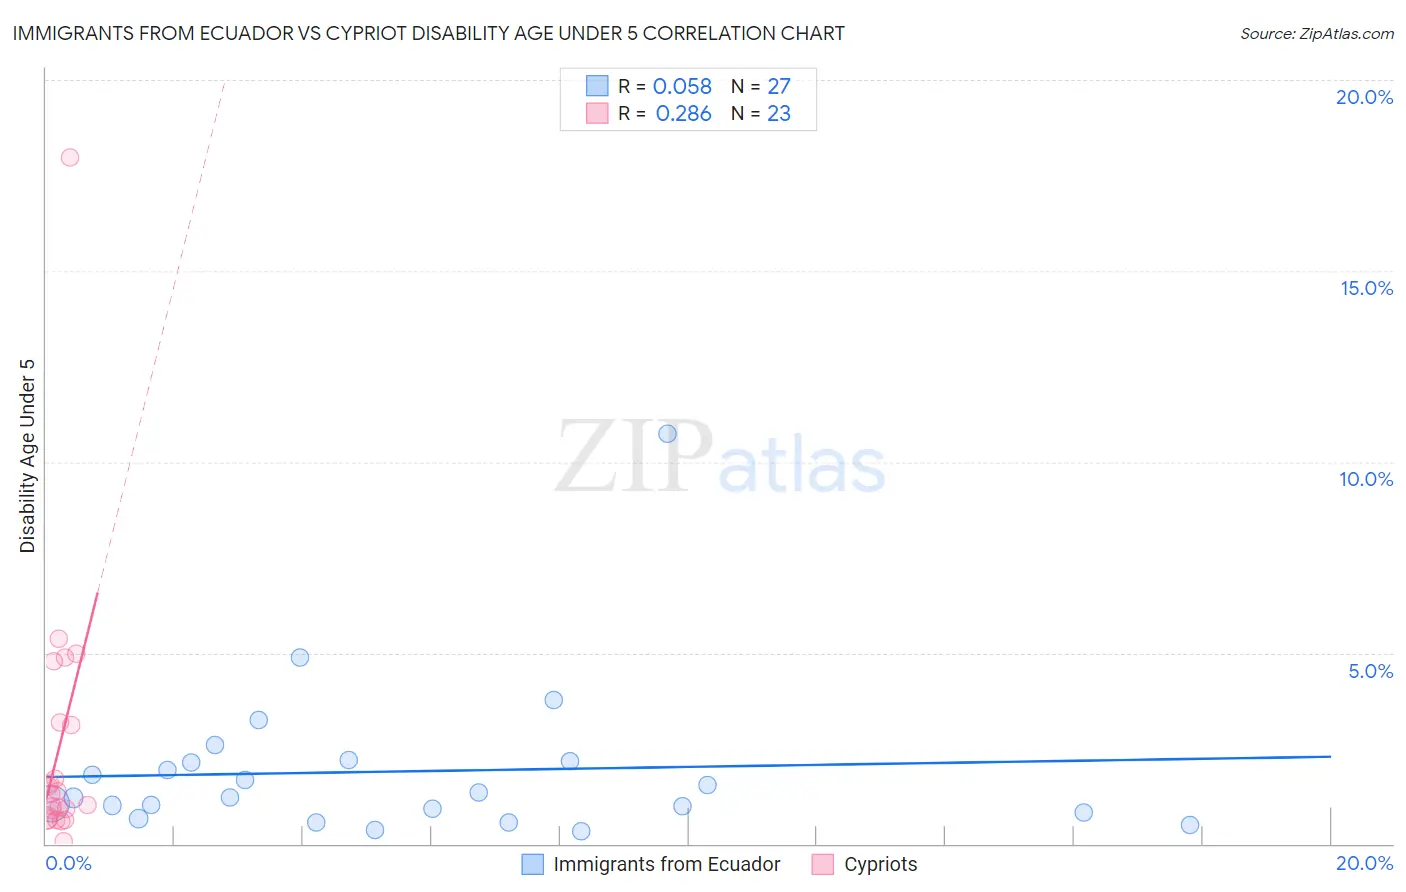
Immigrants from Ecuador vs Cypriot Disability Age Under 5 Correlation Chart
The statistical analysis conducted on geographies consisting of 164,756,181 people shows a slight positive correlation between the proportion of Immigrants from Ecuador and percentage of population with a disability under the age of 5 in the United States with a correlation coefficient (R) of 0.058 and weighted average of 1.1%. Similarly, the statistical analysis conducted on geographies consisting of 48,448,194 people shows a weak positive correlation between the proportion of Cypriots and percentage of population with a disability under the age of 5 in the United States with a correlation coefficient (R) of 0.286 and weighted average of 1.3%, a difference of 15.1%.
Disability Age Under 5 Correlation Summary
| Measurement | Immigrants from Ecuador | Cypriot |
| Minimum | 0.33% | 0.058% |
| Maximum | 10.7% | 18.0% |
| Range | 10.4% | 17.9% |
| Mean | 1.9% | 2.6% |
| Median | 1.2% | 1.3% |
| Interquartile 25% (IQ1) | 0.82% | 0.68% |
| Interquartile 75% (IQ3) | 2.2% | 3.2% |
| Interquartile Range (IQR) | 1.3% | 2.5% |
| Standard Deviation (Sample) | 2.1% | 3.7% |
| Standard Deviation (Population) | 2.0% | 3.6% |
Similar Demographics by Disability Age Under 5
Demographics Similar to Immigrants from Ecuador by Disability Age Under 5
In terms of disability age under 5, the demographic groups most similar to Immigrants from Ecuador are Trinidadian and Tobagonian (1.1%, a difference of 0.060%), Israeli (1.1%, a difference of 0.090%), South African (1.1%, a difference of 0.11%), Immigrants from Belize (1.1%, a difference of 0.15%), and Immigrants from Indonesia (1.1%, a difference of 0.22%).
| Demographics | Rating | Rank | Disability Age Under 5 |
| Immigrants | Vietnam | 99.1 /100 | #63 | Exceptional 1.1% |
| Egyptians | 98.9 /100 | #64 | Exceptional 1.1% |
| Immigrants | Korea | 98.8 /100 | #65 | Exceptional 1.1% |
| Immigrants | Indonesia | 98.7 /100 | #66 | Exceptional 1.1% |
| Immigrants | Belize | 98.7 /100 | #67 | Exceptional 1.1% |
| South Africans | 98.7 /100 | #68 | Exceptional 1.1% |
| Israelis | 98.7 /100 | #69 | Exceptional 1.1% |
| Immigrants | Ecuador | 98.6 /100 | #70 | Exceptional 1.1% |
| Trinidadians and Tobagonians | 98.6 /100 | #71 | Exceptional 1.1% |
| Burmese | 98.5 /100 | #72 | Exceptional 1.1% |
| Immigrants | Sri Lanka | 98.5 /100 | #73 | Exceptional 1.1% |
| Jordanians | 98.5 /100 | #74 | Exceptional 1.1% |
| Immigrants | Pakistan | 98.4 /100 | #75 | Exceptional 1.1% |
| Immigrants | Burma/Myanmar | 98.2 /100 | #76 | Exceptional 1.1% |
| Immigrants | Denmark | 98.1 /100 | #77 | Exceptional 1.1% |
Demographics Similar to Cypriots by Disability Age Under 5
In terms of disability age under 5, the demographic groups most similar to Cypriots are Bangladeshi (1.3%, a difference of 0.10%), Syrian (1.3%, a difference of 0.20%), Malaysian (1.3%, a difference of 0.31%), Immigrants from Chile (1.3%, a difference of 0.37%), and Immigrants from Sudan (1.3%, a difference of 0.60%).
| Demographics | Rating | Rank | Disability Age Under 5 |
| Pakistanis | 19.4 /100 | #210 | Poor 1.3% |
| Immigrants | Greece | 19.1 /100 | #211 | Poor 1.3% |
| Chileans | 18.8 /100 | #212 | Poor 1.3% |
| Immigrants | Sudan | 18.7 /100 | #213 | Poor 1.3% |
| Immigrants | Chile | 17.2 /100 | #214 | Poor 1.3% |
| Syrians | 16.1 /100 | #215 | Poor 1.3% |
| Bangladeshis | 15.5 /100 | #216 | Poor 1.3% |
| Cypriots | 14.9 /100 | #217 | Poor 1.3% |
| Malaysians | 13.2 /100 | #218 | Poor 1.3% |
| Immigrants | Croatia | 11.2 /100 | #219 | Poor 1.3% |
| Serbians | 9.6 /100 | #220 | Tragic 1.3% |
| Sub-Saharan Africans | 8.3 /100 | #221 | Tragic 1.3% |
| Ukrainians | 8.3 /100 | #222 | Tragic 1.3% |
| Hispanics or Latinos | 7.7 /100 | #223 | Tragic 1.3% |
| Latvians | 7.1 /100 | #224 | Tragic 1.3% |