Immigrants from Ecuador vs Black/African American Disability Age Under 5
COMPARE
Immigrants from Ecuador
Black/African American
Disability Age Under 5
Disability Age Under 5 Comparison
Immigrants from Ecuador
Blacks/African Americans
1.1%
DISABILITY AGE UNDER 5
98.6/ 100
METRIC RATING
70th/ 347
METRIC RANK
1.4%
DISABILITY AGE UNDER 5
0.1/ 100
METRIC RATING
272nd/ 347
METRIC RANK
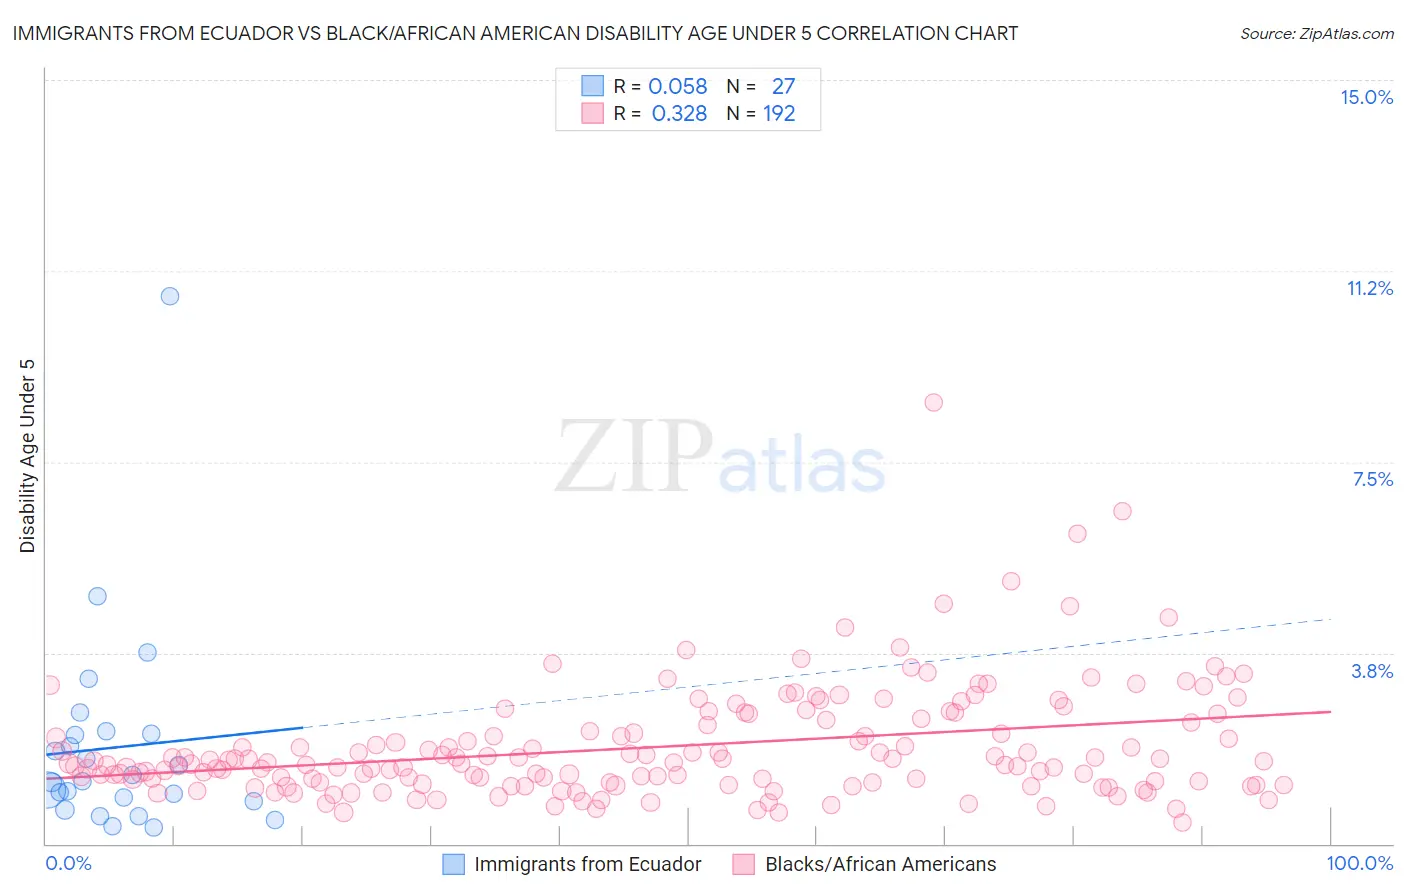
Immigrants from Ecuador vs Black/African American Disability Age Under 5 Correlation Chart
The statistical analysis conducted on geographies consisting of 164,756,181 people shows a slight positive correlation between the proportion of Immigrants from Ecuador and percentage of population with a disability under the age of 5 in the United States with a correlation coefficient (R) of 0.058 and weighted average of 1.1%. Similarly, the statistical analysis conducted on geographies consisting of 261,159,636 people shows a mild positive correlation between the proportion of Blacks/African Americans and percentage of population with a disability under the age of 5 in the United States with a correlation coefficient (R) of 0.328 and weighted average of 1.4%, a difference of 29.1%.
Disability Age Under 5 Correlation Summary
| Measurement | Immigrants from Ecuador | Black/African American |
| Minimum | 0.33% | 0.43% |
| Maximum | 10.7% | 8.7% |
| Range | 10.4% | 8.2% |
| Mean | 1.9% | 1.9% |
| Median | 1.2% | 1.6% |
| Interquartile 25% (IQ1) | 0.82% | 1.2% |
| Interquartile 75% (IQ3) | 2.2% | 2.4% |
| Interquartile Range (IQR) | 1.3% | 1.2% |
| Standard Deviation (Sample) | 2.1% | 1.1% |
| Standard Deviation (Population) | 2.0% | 1.1% |
Similar Demographics by Disability Age Under 5
Demographics Similar to Immigrants from Ecuador by Disability Age Under 5
In terms of disability age under 5, the demographic groups most similar to Immigrants from Ecuador are Trinidadian and Tobagonian (1.1%, a difference of 0.060%), Israeli (1.1%, a difference of 0.090%), South African (1.1%, a difference of 0.11%), Immigrants from Belize (1.1%, a difference of 0.15%), and Immigrants from Indonesia (1.1%, a difference of 0.22%).
| Demographics | Rating | Rank | Disability Age Under 5 |
| Immigrants | Vietnam | 99.1 /100 | #63 | Exceptional 1.1% |
| Egyptians | 98.9 /100 | #64 | Exceptional 1.1% |
| Immigrants | Korea | 98.8 /100 | #65 | Exceptional 1.1% |
| Immigrants | Indonesia | 98.7 /100 | #66 | Exceptional 1.1% |
| Immigrants | Belize | 98.7 /100 | #67 | Exceptional 1.1% |
| South Africans | 98.7 /100 | #68 | Exceptional 1.1% |
| Israelis | 98.7 /100 | #69 | Exceptional 1.1% |
| Immigrants | Ecuador | 98.6 /100 | #70 | Exceptional 1.1% |
| Trinidadians and Tobagonians | 98.6 /100 | #71 | Exceptional 1.1% |
| Burmese | 98.5 /100 | #72 | Exceptional 1.1% |
| Immigrants | Sri Lanka | 98.5 /100 | #73 | Exceptional 1.1% |
| Jordanians | 98.5 /100 | #74 | Exceptional 1.1% |
| Immigrants | Pakistan | 98.4 /100 | #75 | Exceptional 1.1% |
| Immigrants | Burma/Myanmar | 98.2 /100 | #76 | Exceptional 1.1% |
| Immigrants | Denmark | 98.1 /100 | #77 | Exceptional 1.1% |
Demographics Similar to Blacks/African Americans by Disability Age Under 5
In terms of disability age under 5, the demographic groups most similar to Blacks/African Americans are Immigrants from Canada (1.4%, a difference of 0.16%), Immigrants from North America (1.4%, a difference of 0.20%), Alaskan Athabascan (1.5%, a difference of 0.29%), Austrian (1.4%, a difference of 0.33%), and Belgian (1.4%, a difference of 0.51%).
| Demographics | Rating | Rank | Disability Age Under 5 |
| Carpatho Rusyns | 0.1 /100 | #265 | Tragic 1.4% |
| Immigrants | Germany | 0.1 /100 | #266 | Tragic 1.4% |
| Cree | 0.1 /100 | #267 | Tragic 1.4% |
| Belgians | 0.1 /100 | #268 | Tragic 1.4% |
| Austrians | 0.1 /100 | #269 | Tragic 1.4% |
| Immigrants | North America | 0.1 /100 | #270 | Tragic 1.4% |
| Immigrants | Canada | 0.1 /100 | #271 | Tragic 1.4% |
| Blacks/African Americans | 0.1 /100 | #272 | Tragic 1.4% |
| Alaskan Athabascans | 0.1 /100 | #273 | Tragic 1.5% |
| Iroquois | 0.0 /100 | #274 | Tragic 1.5% |
| Brazilians | 0.0 /100 | #275 | Tragic 1.5% |
| Greeks | 0.0 /100 | #276 | Tragic 1.5% |
| Canadians | 0.0 /100 | #277 | Tragic 1.5% |
| Kiowa | 0.0 /100 | #278 | Tragic 1.5% |
| Danes | 0.0 /100 | #279 | Tragic 1.5% |