Immigrants from Eastern Europe vs Korean Female Disability
COMPARE
Immigrants from Eastern Europe
Korean
Female Disability
Female Disability Comparison
Immigrants from Eastern Europe
Koreans
11.8%
FEMALE DISABILITY
97.2/ 100
METRIC RATING
117th/ 347
METRIC RANK
11.7%
FEMALE DISABILITY
99.0/ 100
METRIC RATING
97th/ 347
METRIC RANK
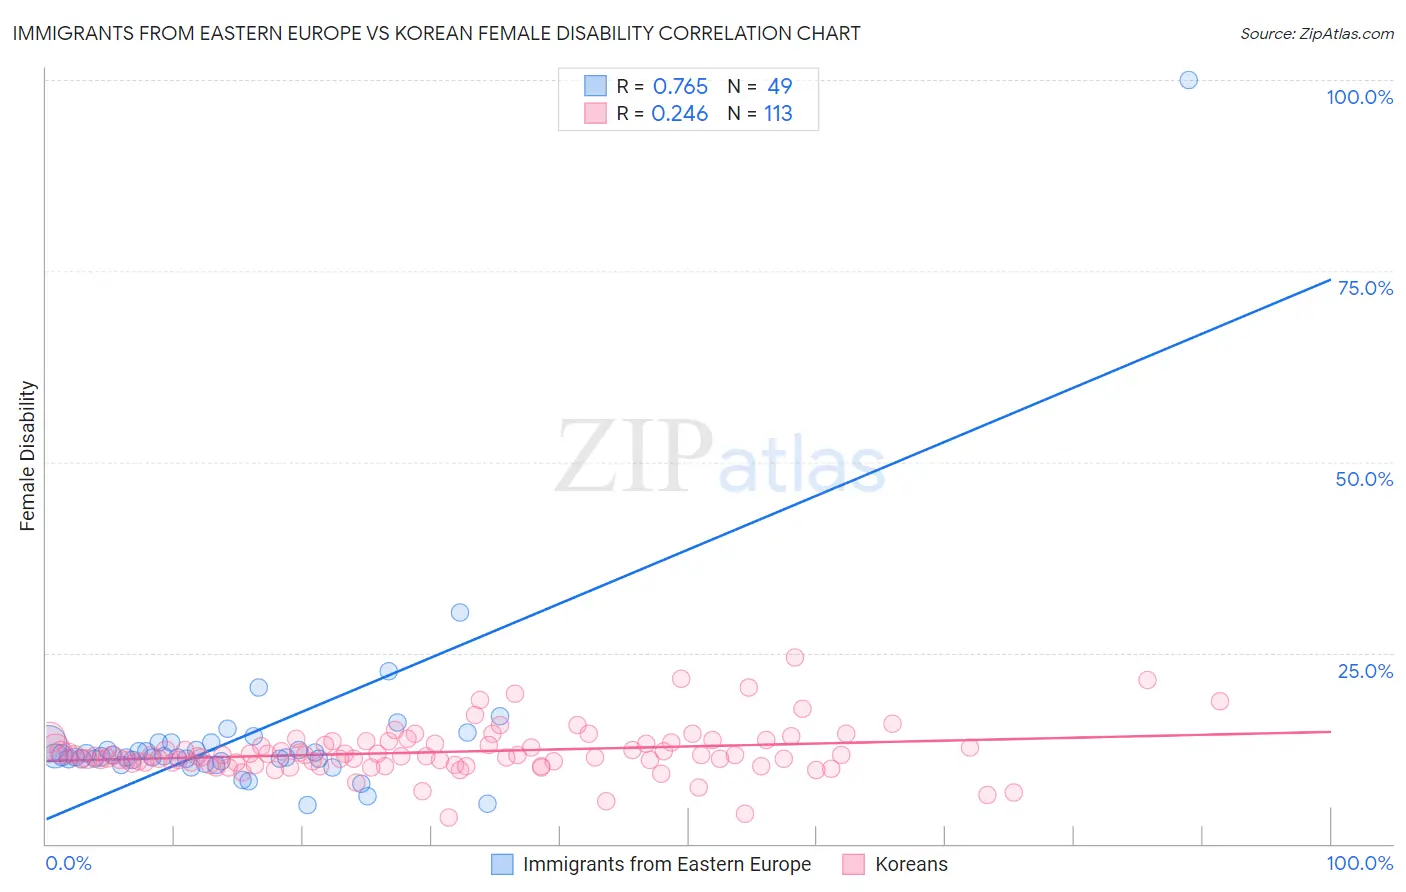
Immigrants from Eastern Europe vs Korean Female Disability Correlation Chart
The statistical analysis conducted on geographies consisting of 475,778,439 people shows a strong positive correlation between the proportion of Immigrants from Eastern Europe and percentage of females with a disability in the United States with a correlation coefficient (R) of 0.765 and weighted average of 11.8%. Similarly, the statistical analysis conducted on geographies consisting of 510,799,967 people shows a weak positive correlation between the proportion of Koreans and percentage of females with a disability in the United States with a correlation coefficient (R) of 0.246 and weighted average of 11.7%, a difference of 1.0%.
Female Disability Correlation Summary
| Measurement | Immigrants from Eastern Europe | Korean |
| Minimum | 5.1% | 3.4% |
| Maximum | 100.0% | 24.4% |
| Range | 94.9% | 21.0% |
| Mean | 13.9% | 12.0% |
| Median | 11.4% | 11.5% |
| Interquartile 25% (IQ1) | 10.9% | 10.6% |
| Interquartile 75% (IQ3) | 13.2% | 13.2% |
| Interquartile Range (IQR) | 2.3% | 2.6% |
| Standard Deviation (Sample) | 13.2% | 3.2% |
| Standard Deviation (Population) | 13.1% | 3.2% |
Demographics Similar to Immigrants from Eastern Europe and Koreans by Female Disability
In terms of female disability, the demographic groups most similar to Immigrants from Eastern Europe are Immigrants from Morocco (11.8%, a difference of 0.15%), South African (11.8%, a difference of 0.20%), Brazilian (11.8%, a difference of 0.20%), Immigrants from Belarus (11.8%, a difference of 0.23%), and Immigrants from Bangladesh (11.8%, a difference of 0.24%). Similarly, the demographic groups most similar to Koreans are Uruguayan (11.7%, a difference of 0.14%), Immigrants from Philippines (11.7%, a difference of 0.35%), Immigrants from Uruguay (11.7%, a difference of 0.40%), Immigrants from Costa Rica (11.7%, a difference of 0.42%), and Immigrants from South Eastern Asia (11.7%, a difference of 0.43%).
| Demographics | Rating | Rank | Female Disability |
| Koreans | 99.0 /100 | #97 | Exceptional 11.7% |
| Uruguayans | 98.8 /100 | #98 | Exceptional 11.7% |
| Immigrants | Philippines | 98.6 /100 | #99 | Exceptional 11.7% |
| Immigrants | Uruguay | 98.5 /100 | #100 | Exceptional 11.7% |
| Immigrants | Costa Rica | 98.4 /100 | #101 | Exceptional 11.7% |
| Immigrants | South Eastern Asia | 98.4 /100 | #102 | Exceptional 11.7% |
| Immigrants | Eastern Africa | 98.3 /100 | #103 | Exceptional 11.7% |
| Immigrants | Western Asia | 98.3 /100 | #104 | Exceptional 11.7% |
| Australians | 98.3 /100 | #105 | Exceptional 11.7% |
| Immigrants | Greece | 98.2 /100 | #106 | Exceptional 11.7% |
| Latvians | 98.2 /100 | #107 | Exceptional 11.7% |
| New Zealanders | 98.1 /100 | #108 | Exceptional 11.7% |
| Immigrants | Immigrants | 98.1 /100 | #109 | Exceptional 11.7% |
| Soviet Union | 98.1 /100 | #110 | Exceptional 11.7% |
| Costa Ricans | 98.1 /100 | #111 | Exceptional 11.7% |
| Immigrants | Bangladesh | 97.8 /100 | #112 | Exceptional 11.8% |
| Immigrants | Belarus | 97.8 /100 | #113 | Exceptional 11.8% |
| South Africans | 97.7 /100 | #114 | Exceptional 11.8% |
| Brazilians | 97.7 /100 | #115 | Exceptional 11.8% |
| Immigrants | Morocco | 97.6 /100 | #116 | Exceptional 11.8% |
| Immigrants | Eastern Europe | 97.2 /100 | #117 | Exceptional 11.8% |