Immigrants from Dominica vs Tohono O'odham Unemployment Among Ages 20 to 24 years
COMPARE
Immigrants from Dominica
Tohono O'odham
Unemployment Among Ages 20 to 24 years
Unemployment Among Ages 20 to 24 years Comparison
Immigrants from Dominica
Tohono O'odham
12.8%
UNEMPLOYMENT AMONG AGES 20 TO 24 YEARS
0.0/ 100
METRIC RATING
316th/ 347
METRIC RANK
12.5%
UNEMPLOYMENT AMONG AGES 20 TO 24 YEARS
0.0/ 100
METRIC RATING
308th/ 347
METRIC RANK
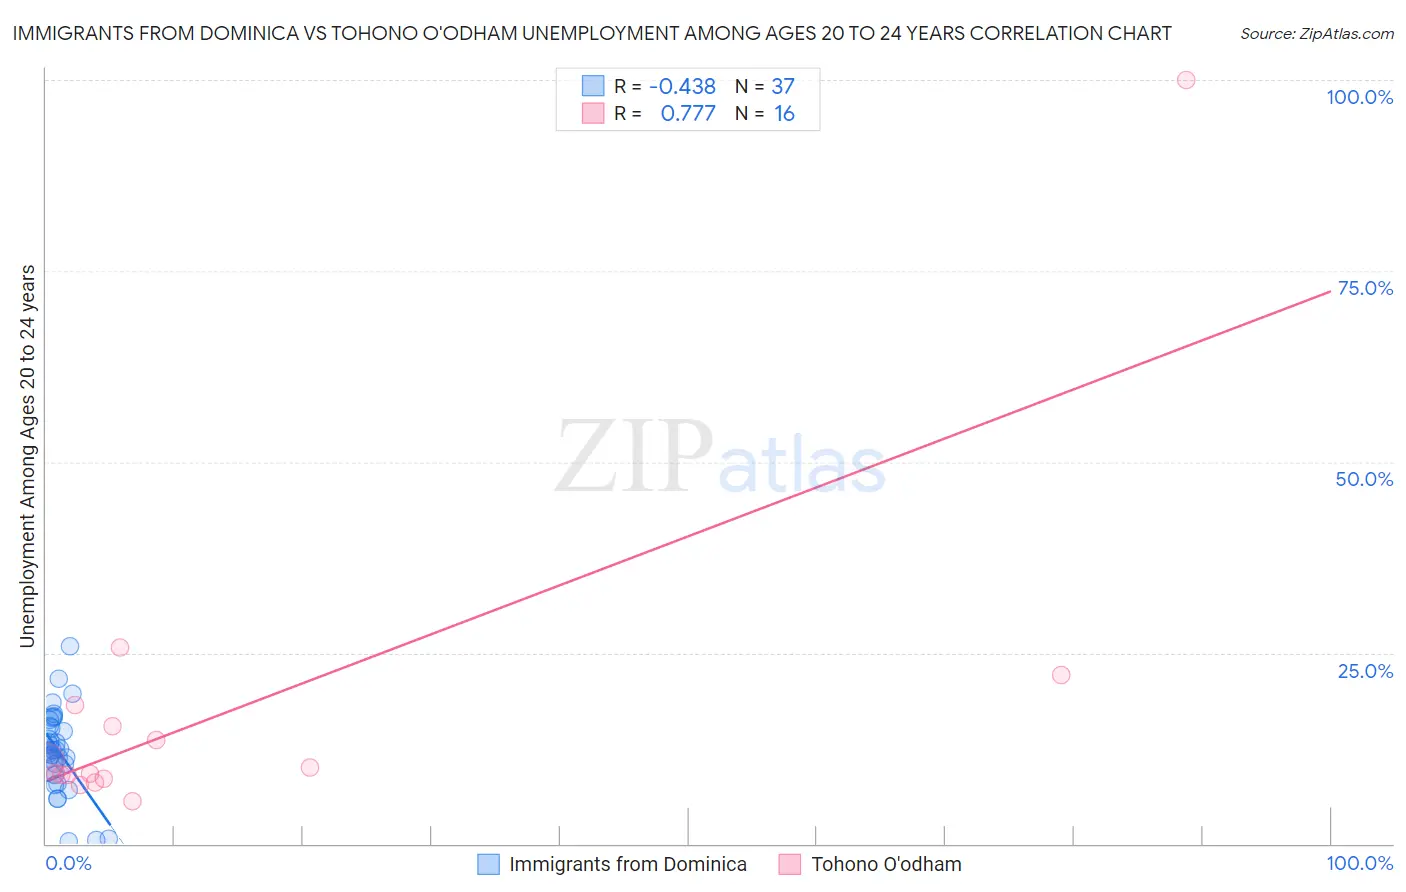
Immigrants from Dominica vs Tohono O'odham Unemployment Among Ages 20 to 24 years Correlation Chart
The statistical analysis conducted on geographies consisting of 83,329,591 people shows a moderate negative correlation between the proportion of Immigrants from Dominica and unemployment rate among population between the ages 20 and 24 in the United States with a correlation coefficient (R) of -0.438 and weighted average of 12.8%. Similarly, the statistical analysis conducted on geographies consisting of 58,461,660 people shows a strong positive correlation between the proportion of Tohono O'odham and unemployment rate among population between the ages 20 and 24 in the United States with a correlation coefficient (R) of 0.777 and weighted average of 12.5%, a difference of 2.2%.
Unemployment Among Ages 20 to 24 years Correlation Summary
| Measurement | Immigrants from Dominica | Tohono O'odham |
| Minimum | 0.30% | 5.5% |
| Maximum | 25.8% | 100.0% |
| Range | 25.5% | 94.5% |
| Mean | 12.1% | 17.6% |
| Median | 12.2% | 9.6% |
| Interquartile 25% (IQ1) | 9.7% | 8.7% |
| Interquartile 75% (IQ3) | 15.8% | 16.8% |
| Interquartile Range (IQR) | 6.1% | 8.0% |
| Standard Deviation (Sample) | 5.5% | 22.7% |
| Standard Deviation (Population) | 5.4% | 21.9% |
Demographics Similar to Immigrants from Dominica and Tohono O'odham by Unemployment Among Ages 20 to 24 years
In terms of unemployment among ages 20 to 24 years, the demographic groups most similar to Immigrants from Dominica are Immigrants from Trinidad and Tobago (12.8%, a difference of 0.12%), Barbadian (12.9%, a difference of 0.37%), West Indian (12.8%, a difference of 0.48%), Trinidadian and Tobagonian (12.9%, a difference of 0.63%), and Black/African American (12.7%, a difference of 0.68%). Similarly, the demographic groups most similar to Tohono O'odham are Immigrants from Bangladesh (12.6%, a difference of 0.080%), Jamaican (12.6%, a difference of 0.20%), Vietnamese (12.6%, a difference of 0.64%), Bermudan (12.5%, a difference of 0.68%), and Houma (12.6%, a difference of 0.79%).
| Demographics | Rating | Rank | Unemployment Among Ages 20 to 24 years |
| Immigrants | Cabo Verde | 0.0 /100 | #302 | Tragic 12.2% |
| Haitians | 0.0 /100 | #303 | Tragic 12.2% |
| Immigrants | West Indies | 0.0 /100 | #304 | Tragic 12.3% |
| Chippewa | 0.0 /100 | #305 | Tragic 12.3% |
| Immigrants | Haiti | 0.0 /100 | #306 | Tragic 12.4% |
| Bermudans | 0.0 /100 | #307 | Tragic 12.5% |
| Tohono O'odham | 0.0 /100 | #308 | Tragic 12.5% |
| Immigrants | Bangladesh | 0.0 /100 | #309 | Tragic 12.6% |
| Jamaicans | 0.0 /100 | #310 | Tragic 12.6% |
| Vietnamese | 0.0 /100 | #311 | Tragic 12.6% |
| Houma | 0.0 /100 | #312 | Tragic 12.6% |
| Shoshone | 0.0 /100 | #313 | Tragic 12.7% |
| Blacks/African Americans | 0.0 /100 | #314 | Tragic 12.7% |
| West Indians | 0.0 /100 | #315 | Tragic 12.8% |
| Immigrants | Dominica | 0.0 /100 | #316 | Tragic 12.8% |
| Immigrants | Trinidad and Tobago | 0.0 /100 | #317 | Tragic 12.8% |
| Barbadians | 0.0 /100 | #318 | Tragic 12.9% |
| Trinidadians and Tobagonians | 0.0 /100 | #319 | Tragic 12.9% |
| Cheyenne | 0.0 /100 | #320 | Tragic 13.0% |
| Immigrants | Jamaica | 0.0 /100 | #321 | Tragic 13.0% |
| Natives/Alaskans | 0.0 /100 | #322 | Tragic 13.0% |