Immigrants from Dominica vs Senegalese Cognitive Disability
COMPARE
Immigrants from Dominica
Senegalese
Cognitive Disability
Cognitive Disability Comparison
Immigrants from Dominica
Senegalese
18.6%
COGNITIVE DISABILITY
0.0/ 100
METRIC RATING
315th/ 347
METRIC RANK
19.0%
COGNITIVE DISABILITY
0.0/ 100
METRIC RATING
335th/ 347
METRIC RANK
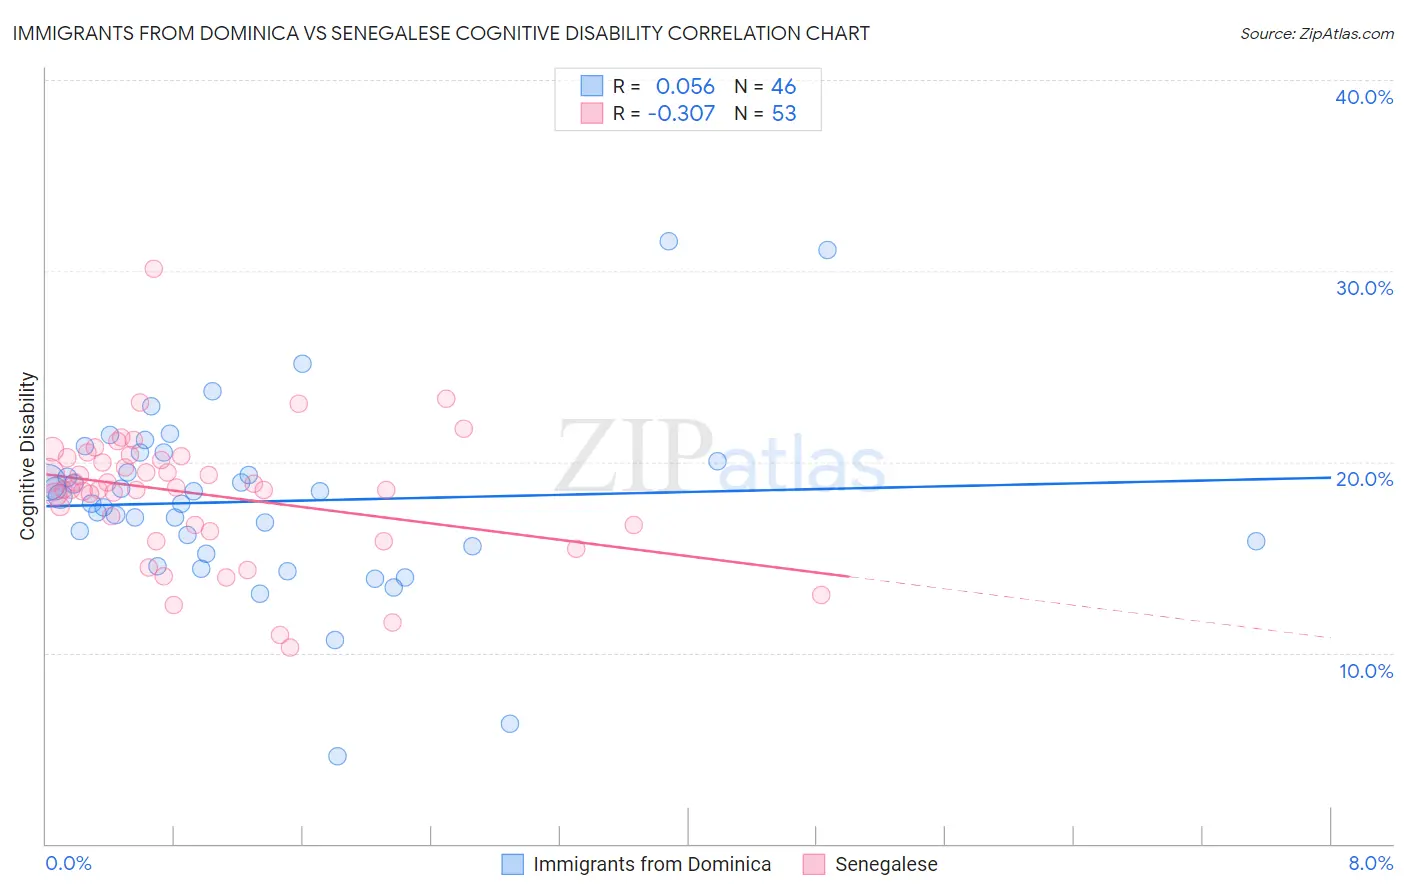
Immigrants from Dominica vs Senegalese Cognitive Disability Correlation Chart
The statistical analysis conducted on geographies consisting of 83,793,635 people shows a slight positive correlation between the proportion of Immigrants from Dominica and percentage of population with cognitive disability in the United States with a correlation coefficient (R) of 0.056 and weighted average of 18.6%. Similarly, the statistical analysis conducted on geographies consisting of 78,141,567 people shows a mild negative correlation between the proportion of Senegalese and percentage of population with cognitive disability in the United States with a correlation coefficient (R) of -0.307 and weighted average of 19.0%, a difference of 2.3%.
Cognitive Disability Correlation Summary
| Measurement | Immigrants from Dominica | Senegalese |
| Minimum | 4.6% | 10.3% |
| Maximum | 31.5% | 30.1% |
| Range | 27.0% | 19.8% |
| Mean | 17.9% | 18.3% |
| Median | 18.0% | 18.6% |
| Interquartile 25% (IQ1) | 15.6% | 16.5% |
| Interquartile 75% (IQ3) | 20.0% | 20.3% |
| Interquartile Range (IQR) | 4.5% | 3.8% |
| Standard Deviation (Sample) | 4.8% | 3.4% |
| Standard Deviation (Population) | 4.8% | 3.4% |
Demographics Similar to Immigrants from Dominica and Senegalese by Cognitive Disability
In terms of cognitive disability, the demographic groups most similar to Immigrants from Dominica are Immigrants from Middle Africa (18.6%, a difference of 0.080%), Liberian (18.6%, a difference of 0.16%), Bangladeshi (18.6%, a difference of 0.28%), Comanche (18.6%, a difference of 0.32%), and Apache (18.6%, a difference of 0.36%). Similarly, the demographic groups most similar to Senegalese are Sudanese (18.9%, a difference of 0.54%), Immigrants from Yemen (18.8%, a difference of 0.93%), Immigrants from Sudan (18.8%, a difference of 0.99%), Pima (18.8%, a difference of 1.0%), and Immigrants from Dominican Republic (18.8%, a difference of 1.1%).
| Demographics | Rating | Rank | Cognitive Disability |
| Immigrants | Dominica | 0.0 /100 | #315 | Tragic 18.6% |
| Immigrants | Middle Africa | 0.0 /100 | #316 | Tragic 18.6% |
| Liberians | 0.0 /100 | #317 | Tragic 18.6% |
| Bangladeshis | 0.0 /100 | #318 | Tragic 18.6% |
| Comanche | 0.0 /100 | #319 | Tragic 18.6% |
| Apache | 0.0 /100 | #320 | Tragic 18.6% |
| Africans | 0.0 /100 | #321 | Tragic 18.6% |
| Immigrants | Liberia | 0.0 /100 | #322 | Tragic 18.7% |
| Pueblo | 0.0 /100 | #323 | Tragic 18.7% |
| Dominicans | 0.0 /100 | #324 | Tragic 18.7% |
| Indonesians | 0.0 /100 | #325 | Tragic 18.7% |
| Immigrants | Senegal | 0.0 /100 | #326 | Tragic 18.7% |
| U.S. Virgin Islanders | 0.0 /100 | #327 | Tragic 18.7% |
| Kiowa | 0.0 /100 | #328 | Tragic 18.7% |
| Navajo | 0.0 /100 | #329 | Tragic 18.8% |
| Immigrants | Dominican Republic | 0.0 /100 | #330 | Tragic 18.8% |
| Pima | 0.0 /100 | #331 | Tragic 18.8% |
| Immigrants | Sudan | 0.0 /100 | #332 | Tragic 18.8% |
| Immigrants | Yemen | 0.0 /100 | #333 | Tragic 18.8% |
| Sudanese | 0.0 /100 | #334 | Tragic 18.9% |
| Senegalese | 0.0 /100 | #335 | Tragic 19.0% |