Immigrants from Korea vs Native Hawaiian Hearing Disability
COMPARE
Immigrants from Korea
Native Hawaiian
Hearing Disability
Hearing Disability Comparison
Immigrants from Korea
Native Hawaiians
2.7%
HEARING DISABILITY
97.5/ 100
METRIC RATING
74th/ 347
METRIC RANK
3.7%
HEARING DISABILITY
0.0/ 100
METRIC RATING
292nd/ 347
METRIC RANK
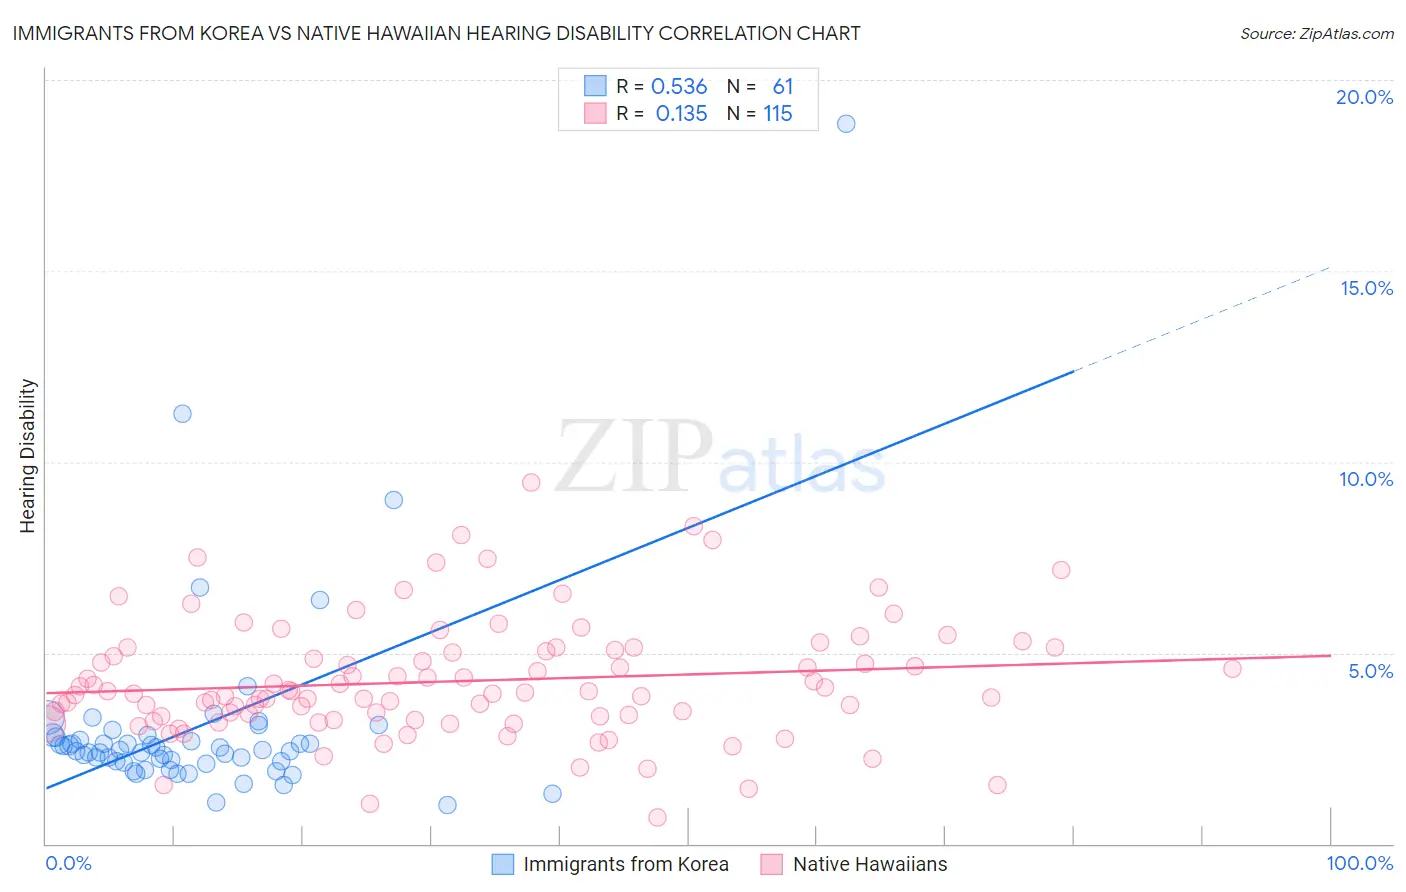
Immigrants from Korea vs Native Hawaiian Hearing Disability Correlation Chart
The statistical analysis conducted on geographies consisting of 416,138,137 people shows a substantial positive correlation between the proportion of Immigrants from Korea and percentage of population with hearing disability in the United States with a correlation coefficient (R) of 0.536 and weighted average of 2.7%. Similarly, the statistical analysis conducted on geographies consisting of 331,966,611 people shows a poor positive correlation between the proportion of Native Hawaiians and percentage of population with hearing disability in the United States with a correlation coefficient (R) of 0.135 and weighted average of 3.7%, a difference of 34.7%.
Hearing Disability Correlation Summary
| Measurement | Immigrants from Korea | Native Hawaiian |
| Minimum | 1.0% | 0.70% |
| Maximum | 18.9% | 9.4% |
| Range | 17.8% | 8.7% |
| Mean | 3.1% | 4.3% |
| Median | 2.5% | 4.0% |
| Interquartile 25% (IQ1) | 2.1% | 3.3% |
| Interquartile 75% (IQ3) | 2.8% | 5.1% |
| Interquartile Range (IQR) | 0.67% | 1.7% |
| Standard Deviation (Sample) | 2.6% | 1.6% |
| Standard Deviation (Population) | 2.6% | 1.5% |
Similar Demographics by Hearing Disability
Demographics Similar to Immigrants from Korea by Hearing Disability
In terms of hearing disability, the demographic groups most similar to Immigrants from Korea are Argentinean (2.7%, a difference of 0.0%), Immigrants from Saudi Arabia (2.7%, a difference of 0.030%), Asian (2.7%, a difference of 0.030%), Immigrants from Malaysia (2.7%, a difference of 0.050%), and Afghan (2.7%, a difference of 0.080%).
| Demographics | Rating | Rank | Hearing Disability |
| Egyptians | 98.1 /100 | #67 | Exceptional 2.7% |
| Immigrants | Africa | 98.0 /100 | #68 | Exceptional 2.7% |
| Nicaraguans | 97.9 /100 | #69 | Exceptional 2.7% |
| Peruvians | 97.7 /100 | #70 | Exceptional 2.7% |
| Central Americans | 97.7 /100 | #71 | Exceptional 2.7% |
| Afghans | 97.6 /100 | #72 | Exceptional 2.7% |
| Argentineans | 97.5 /100 | #73 | Exceptional 2.7% |
| Immigrants | Korea | 97.5 /100 | #74 | Exceptional 2.7% |
| Immigrants | Saudi Arabia | 97.5 /100 | #75 | Exceptional 2.7% |
| Asians | 97.5 /100 | #76 | Exceptional 2.7% |
| Immigrants | Malaysia | 97.5 /100 | #77 | Exceptional 2.7% |
| Mongolians | 97.4 /100 | #78 | Exceptional 2.7% |
| Colombians | 97.4 /100 | #79 | Exceptional 2.7% |
| Immigrants | Asia | 97.2 /100 | #80 | Exceptional 2.7% |
| Immigrants | Uruguay | 97.2 /100 | #81 | Exceptional 2.7% |
Demographics Similar to Native Hawaiians by Hearing Disability
In terms of hearing disability, the demographic groups most similar to Native Hawaiians are Finnish (3.7%, a difference of 0.060%), Norwegian (3.7%, a difference of 0.060%), White/Caucasian (3.7%, a difference of 0.080%), Chinese (3.7%, a difference of 0.21%), and Iroquois (3.7%, a difference of 0.30%).
| Demographics | Rating | Rank | Hearing Disability |
| Sioux | 0.0 /100 | #285 | Tragic 3.6% |
| Delaware | 0.0 /100 | #286 | Tragic 3.6% |
| Spanish | 0.0 /100 | #287 | Tragic 3.7% |
| Irish | 0.0 /100 | #288 | Tragic 3.7% |
| Chinese | 0.0 /100 | #289 | Tragic 3.7% |
| Whites/Caucasians | 0.0 /100 | #290 | Tragic 3.7% |
| Finns | 0.0 /100 | #291 | Tragic 3.7% |
| Native Hawaiians | 0.0 /100 | #292 | Tragic 3.7% |
| Norwegians | 0.0 /100 | #293 | Tragic 3.7% |
| Iroquois | 0.0 /100 | #294 | Tragic 3.7% |
| Welsh | 0.0 /100 | #295 | Tragic 3.7% |
| Pima | 0.0 /100 | #296 | Tragic 3.7% |
| Immigrants | Azores | 0.0 /100 | #297 | Tragic 3.7% |
| Celtics | 0.0 /100 | #298 | Tragic 3.7% |
| Germans | 0.0 /100 | #299 | Tragic 3.7% |