Crow vs Kenyan Ambulatory Disability
COMPARE
Crow
Kenyan
Ambulatory Disability
Ambulatory Disability Comparison
Crow
Kenyans
6.9%
AMBULATORY DISABILITY
0.0/ 100
METRIC RATING
295th/ 347
METRIC RANK
5.8%
AMBULATORY DISABILITY
98.4/ 100
METRIC RATING
94th/ 347
METRIC RANK
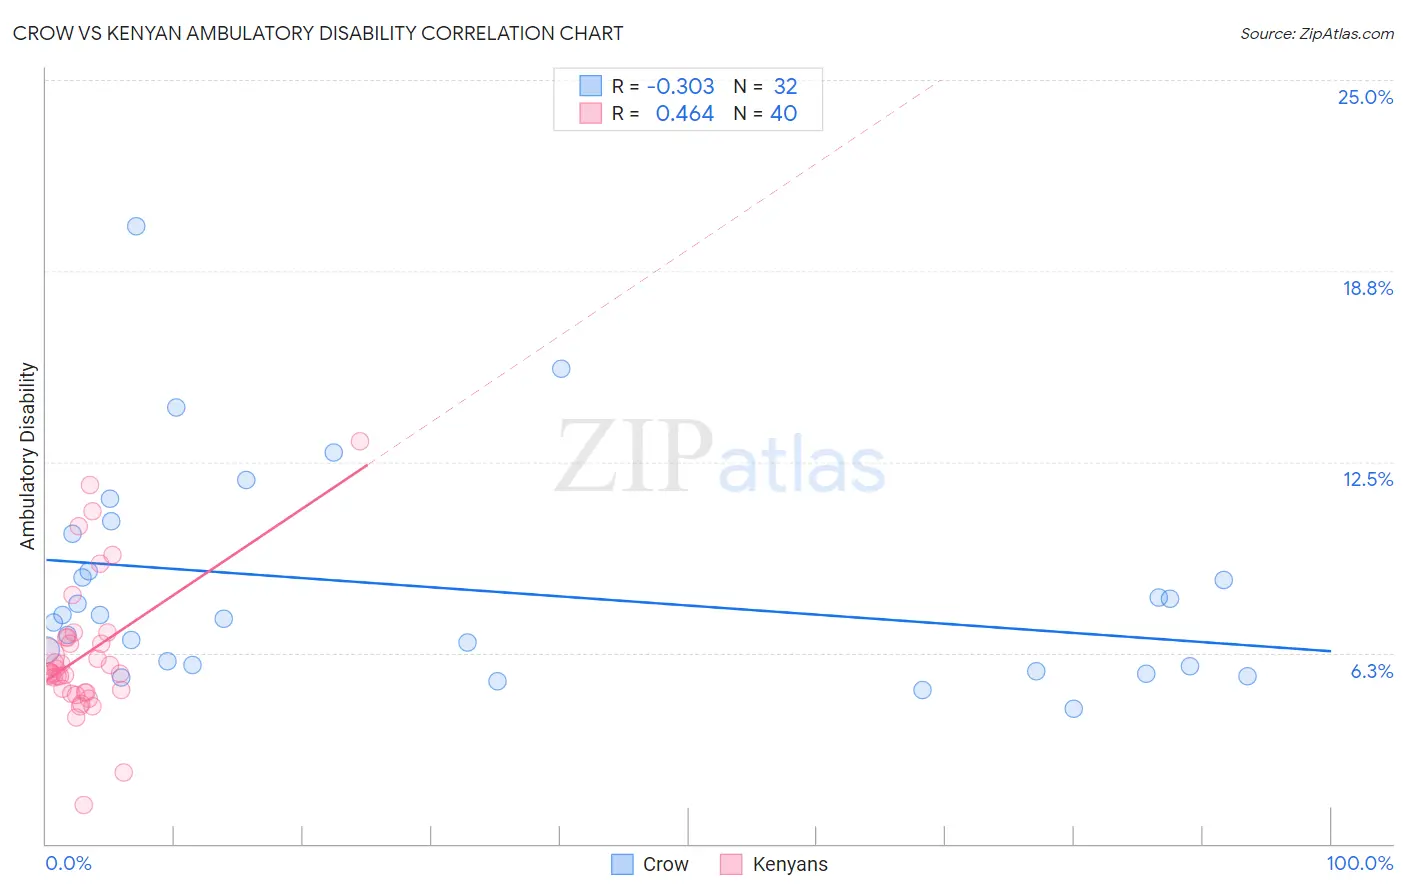
Crow vs Kenyan Ambulatory Disability Correlation Chart
The statistical analysis conducted on geographies consisting of 59,204,118 people shows a mild negative correlation between the proportion of Crow and percentage of population with ambulatory disability in the United States with a correlation coefficient (R) of -0.303 and weighted average of 6.9%. Similarly, the statistical analysis conducted on geographies consisting of 168,175,436 people shows a moderate positive correlation between the proportion of Kenyans and percentage of population with ambulatory disability in the United States with a correlation coefficient (R) of 0.464 and weighted average of 5.8%, a difference of 19.5%.
Ambulatory Disability Correlation Summary
| Measurement | Crow | Kenyan |
| Minimum | 4.4% | 1.3% |
| Maximum | 20.2% | 13.2% |
| Range | 15.8% | 11.9% |
| Mean | 8.4% | 6.2% |
| Median | 7.4% | 5.6% |
| Interquartile 25% (IQ1) | 5.8% | 5.0% |
| Interquartile 75% (IQ3) | 9.5% | 6.8% |
| Interquartile Range (IQR) | 3.7% | 1.8% |
| Standard Deviation (Sample) | 3.5% | 2.3% |
| Standard Deviation (Population) | 3.4% | 2.3% |
Similar Demographics by Ambulatory Disability
Demographics Similar to Crow by Ambulatory Disability
In terms of ambulatory disability, the demographic groups most similar to Crow are Cape Verdean (6.9%, a difference of 0.070%), Alaskan Athabascan (6.9%, a difference of 0.23%), Immigrants from St. Vincent and the Grenadines (6.9%, a difference of 0.26%), French American Indian (6.9%, a difference of 0.40%), and Immigrants from Grenada (6.9%, a difference of 0.41%).
| Demographics | Rating | Rank | Ambulatory Disability |
| Immigrants | Nonimmigrants | 0.0 /100 | #288 | Tragic 6.9% |
| Immigrants | Dominica | 0.0 /100 | #289 | Tragic 6.9% |
| Scotch-Irish | 0.0 /100 | #290 | Tragic 6.9% |
| West Indians | 0.0 /100 | #291 | Tragic 6.9% |
| Cheyenne | 0.0 /100 | #292 | Tragic 6.9% |
| Immigrants | St. Vincent and the Grenadines | 0.0 /100 | #293 | Tragic 6.9% |
| Cape Verdeans | 0.0 /100 | #294 | Tragic 6.9% |
| Crow | 0.0 /100 | #295 | Tragic 6.9% |
| Alaskan Athabascans | 0.0 /100 | #296 | Tragic 6.9% |
| French American Indians | 0.0 /100 | #297 | Tragic 6.9% |
| Immigrants | Grenada | 0.0 /100 | #298 | Tragic 6.9% |
| Puget Sound Salish | 0.0 /100 | #299 | Tragic 6.9% |
| Marshallese | 0.0 /100 | #300 | Tragic 6.9% |
| British West Indians | 0.0 /100 | #301 | Tragic 7.0% |
| Immigrants | Armenia | 0.0 /100 | #302 | Tragic 7.0% |
Demographics Similar to Kenyans by Ambulatory Disability
In terms of ambulatory disability, the demographic groups most similar to Kenyans are Immigrants from El Salvador (5.8%, a difference of 0.040%), Salvadoran (5.8%, a difference of 0.060%), Immigrants from Somalia (5.8%, a difference of 0.10%), Immigrants from Lebanon (5.8%, a difference of 0.12%), and Immigrants from Denmark (5.8%, a difference of 0.19%).
| Demographics | Rating | Rank | Ambulatory Disability |
| Immigrants | Chile | 98.9 /100 | #87 | Exceptional 5.8% |
| Soviet Union | 98.9 /100 | #88 | Exceptional 5.8% |
| Bhutanese | 98.8 /100 | #89 | Exceptional 5.8% |
| Australians | 98.8 /100 | #90 | Exceptional 5.8% |
| Immigrants | Sudan | 98.8 /100 | #91 | Exceptional 5.8% |
| Immigrants | Sierra Leone | 98.6 /100 | #92 | Exceptional 5.8% |
| Immigrants | Denmark | 98.6 /100 | #93 | Exceptional 5.8% |
| Kenyans | 98.4 /100 | #94 | Exceptional 5.8% |
| Immigrants | El Salvador | 98.4 /100 | #95 | Exceptional 5.8% |
| Salvadorans | 98.4 /100 | #96 | Exceptional 5.8% |
| Immigrants | Somalia | 98.3 /100 | #97 | Exceptional 5.8% |
| Immigrants | Lebanon | 98.3 /100 | #98 | Exceptional 5.8% |
| Immigrants | Northern Europe | 98.2 /100 | #99 | Exceptional 5.8% |
| Immigrants | Serbia | 97.9 /100 | #100 | Exceptional 5.8% |
| Immigrants | South America | 97.9 /100 | #101 | Exceptional 5.8% |