Immigrants from Cuba vs Immigrants from Costa Rica Male Disability
COMPARE
Immigrants from Cuba
Immigrants from Costa Rica
Male Disability
Male Disability Comparison
Immigrants from Cuba
Immigrants from Costa Rica
10.9%
MALE DISABILITY
90.2/ 100
METRIC RATING
118th/ 347
METRIC RANK
11.0%
MALE DISABILITY
82.8/ 100
METRIC RATING
136th/ 347
METRIC RANK
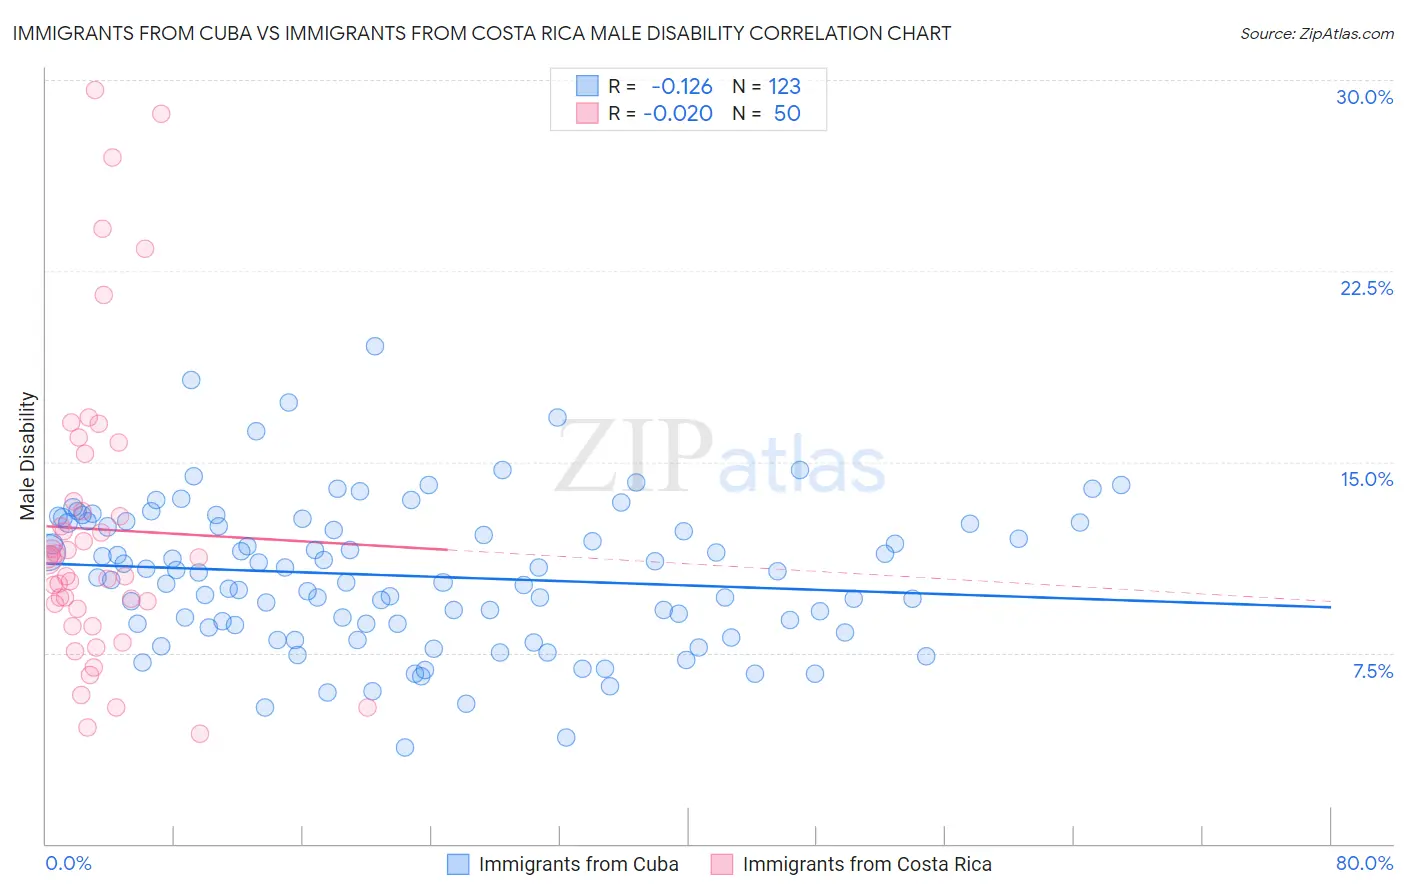
Immigrants from Cuba vs Immigrants from Costa Rica Male Disability Correlation Chart
The statistical analysis conducted on geographies consisting of 325,990,586 people shows a poor negative correlation between the proportion of Immigrants from Cuba and percentage of males with a disability in the United States with a correlation coefficient (R) of -0.126 and weighted average of 10.9%. Similarly, the statistical analysis conducted on geographies consisting of 204,275,290 people shows no correlation between the proportion of Immigrants from Costa Rica and percentage of males with a disability in the United States with a correlation coefficient (R) of -0.020 and weighted average of 11.0%, a difference of 0.92%.
Male Disability Correlation Summary
| Measurement | Immigrants from Cuba | Immigrants from Costa Rica |
| Minimum | 3.8% | 4.3% |
| Maximum | 19.5% | 29.6% |
| Range | 15.7% | 25.3% |
| Mean | 10.5% | 12.4% |
| Median | 10.5% | 11.2% |
| Interquartile 25% (IQ1) | 8.6% | 9.2% |
| Interquartile 75% (IQ3) | 12.6% | 13.4% |
| Interquartile Range (IQR) | 4.0% | 4.2% |
| Standard Deviation (Sample) | 2.9% | 5.9% |
| Standard Deviation (Population) | 2.8% | 5.9% |
Demographics Similar to Immigrants from Cuba and Immigrants from Costa Rica by Male Disability
In terms of male disability, the demographic groups most similar to Immigrants from Cuba are Armenian (10.9%, a difference of 0.0%), Eastern European (10.9%, a difference of 0.080%), Immigrants from Africa (10.9%, a difference of 0.11%), Immigrants from South Eastern Asia (10.9%, a difference of 0.15%), and Immigrants from Ghana (10.9%, a difference of 0.17%). Similarly, the demographic groups most similar to Immigrants from Costa Rica are Trinidadian and Tobagonian (11.0%, a difference of 0.040%), Bhutanese (11.0%, a difference of 0.060%), Immigrants from Europe (11.0%, a difference of 0.080%), Ugandan (11.0%, a difference of 0.11%), and Immigrants from Fiji (11.0%, a difference of 0.13%).
| Demographics | Rating | Rank | Male Disability |
| Eastern Europeans | 90.6 /100 | #117 | Exceptional 10.9% |
| Immigrants | Cuba | 90.2 /100 | #118 | Exceptional 10.9% |
| Armenians | 90.1 /100 | #119 | Exceptional 10.9% |
| Immigrants | Africa | 89.4 /100 | #120 | Excellent 10.9% |
| Immigrants | South Eastern Asia | 89.2 /100 | #121 | Excellent 10.9% |
| Immigrants | Ghana | 89.0 /100 | #122 | Excellent 10.9% |
| Immigrants | Czechoslovakia | 88.4 /100 | #123 | Excellent 10.9% |
| South American Indians | 88.1 /100 | #124 | Excellent 10.9% |
| Immigrants | North Macedonia | 88.1 /100 | #125 | Excellent 10.9% |
| Immigrants | Trinidad and Tobago | 86.9 /100 | #126 | Excellent 10.9% |
| Immigrants | Ukraine | 86.8 /100 | #127 | Excellent 10.9% |
| Immigrants | Latvia | 85.5 /100 | #128 | Excellent 10.9% |
| Immigrants | Philippines | 85.4 /100 | #129 | Excellent 10.9% |
| Brazilians | 85.4 /100 | #130 | Excellent 10.9% |
| Macedonians | 84.2 /100 | #131 | Excellent 11.0% |
| Immigrants | Fiji | 84.0 /100 | #132 | Excellent 11.0% |
| Ugandans | 83.9 /100 | #133 | Excellent 11.0% |
| Bhutanese | 83.4 /100 | #134 | Excellent 11.0% |
| Trinidadians and Tobagonians | 83.3 /100 | #135 | Excellent 11.0% |
| Immigrants | Costa Rica | 82.8 /100 | #136 | Excellent 11.0% |
| Immigrants | Europe | 82.0 /100 | #137 | Excellent 11.0% |