Immigrants from Cuba vs Immigrants from Uruguay Male Disability
COMPARE
Immigrants from Cuba
Immigrants from Uruguay
Male Disability
Male Disability Comparison
Immigrants from Cuba
Immigrants from Uruguay
10.9%
MALE DISABILITY
90.2/ 100
METRIC RATING
118th/ 347
METRIC RANK
10.8%
MALE DISABILITY
93.8/ 100
METRIC RATING
111th/ 347
METRIC RANK
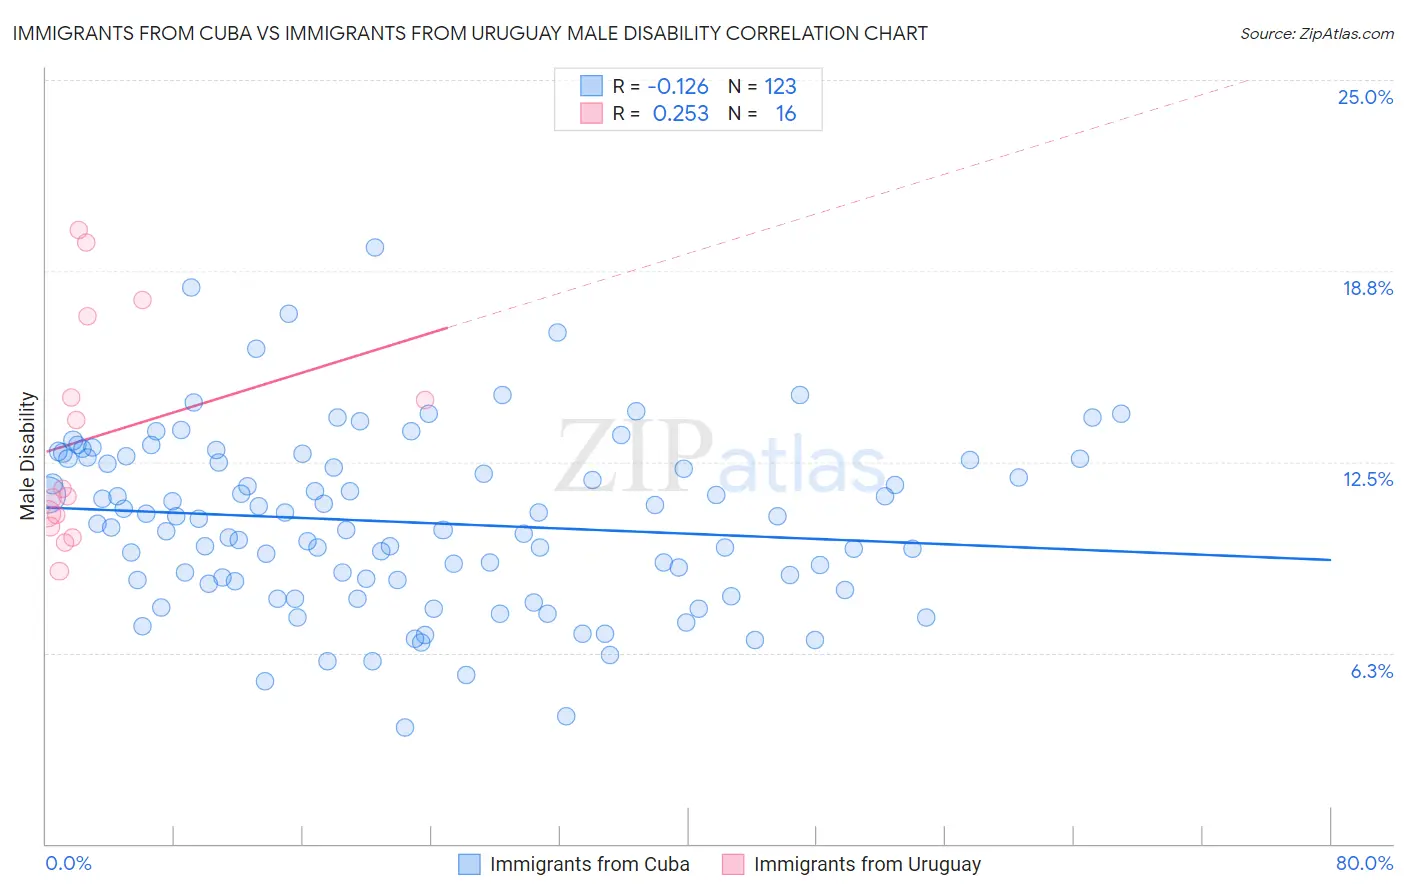
Immigrants from Cuba vs Immigrants from Uruguay Male Disability Correlation Chart
The statistical analysis conducted on geographies consisting of 325,990,586 people shows a poor negative correlation between the proportion of Immigrants from Cuba and percentage of males with a disability in the United States with a correlation coefficient (R) of -0.126 and weighted average of 10.9%. Similarly, the statistical analysis conducted on geographies consisting of 133,255,356 people shows a weak positive correlation between the proportion of Immigrants from Uruguay and percentage of males with a disability in the United States with a correlation coefficient (R) of 0.253 and weighted average of 10.8%, a difference of 0.71%.
Male Disability Correlation Summary
| Measurement | Immigrants from Cuba | Immigrants from Uruguay |
| Minimum | 3.8% | 8.9% |
| Maximum | 19.5% | 20.1% |
| Range | 15.7% | 11.1% |
| Mean | 10.5% | 13.3% |
| Median | 10.5% | 11.5% |
| Interquartile 25% (IQ1) | 8.6% | 10.6% |
| Interquartile 75% (IQ3) | 12.6% | 15.9% |
| Interquartile Range (IQR) | 4.0% | 5.3% |
| Standard Deviation (Sample) | 2.9% | 3.6% |
| Standard Deviation (Population) | 2.8% | 3.5% |
Demographics Similar to Immigrants from Cuba and Immigrants from Uruguay by Male Disability
In terms of male disability, the demographic groups most similar to Immigrants from Cuba are Armenian (10.9%, a difference of 0.0%), Eastern European (10.9%, a difference of 0.080%), Immigrants from Africa (10.9%, a difference of 0.11%), Immigrants from South Eastern Asia (10.9%, a difference of 0.15%), and Immigrants from Ghana (10.9%, a difference of 0.17%). Similarly, the demographic groups most similar to Immigrants from Uruguay are Immigrants (10.8%, a difference of 0.040%), Immigrants from Uganda (10.8%, a difference of 0.060%), Ghanaian (10.8%, a difference of 0.10%), Immigrants from Belgium (10.8%, a difference of 0.11%), and Immigrants from Eastern Africa (10.8%, a difference of 0.13%).
| Demographics | Rating | Rank | Male Disability |
| Immigrants | Nigeria | 95.1 /100 | #104 | Exceptional 10.8% |
| Immigrants | Brazil | 95.0 /100 | #105 | Exceptional 10.8% |
| Immigrants | Syria | 94.9 /100 | #106 | Exceptional 10.8% |
| Immigrants | Eastern Africa | 94.3 /100 | #107 | Exceptional 10.8% |
| Immigrants | Belgium | 94.2 /100 | #108 | Exceptional 10.8% |
| Immigrants | Uganda | 94.0 /100 | #109 | Exceptional 10.8% |
| Immigrants | Immigrants | 93.9 /100 | #110 | Exceptional 10.8% |
| Immigrants | Uruguay | 93.8 /100 | #111 | Exceptional 10.8% |
| Ghanaians | 93.4 /100 | #112 | Exceptional 10.8% |
| Immigrants | Zimbabwe | 93.0 /100 | #113 | Exceptional 10.8% |
| Central Americans | 92.7 /100 | #114 | Exceptional 10.8% |
| Immigrants | Barbados | 92.2 /100 | #115 | Exceptional 10.8% |
| Immigrants | South Africa | 91.8 /100 | #116 | Exceptional 10.8% |
| Eastern Europeans | 90.6 /100 | #117 | Exceptional 10.9% |
| Immigrants | Cuba | 90.2 /100 | #118 | Exceptional 10.9% |
| Armenians | 90.1 /100 | #119 | Exceptional 10.9% |
| Immigrants | Africa | 89.4 /100 | #120 | Excellent 10.9% |
| Immigrants | South Eastern Asia | 89.2 /100 | #121 | Excellent 10.9% |
| Immigrants | Ghana | 89.0 /100 | #122 | Excellent 10.9% |
| Immigrants | Czechoslovakia | 88.4 /100 | #123 | Excellent 10.9% |
| South American Indians | 88.1 /100 | #124 | Excellent 10.9% |